Starbucks 2013 Annual Report Download - page 29
Download and view the complete annual report
Please find page 29 of the 2013 Starbucks annual report below. You can navigate through the pages in the report by either clicking on the pages listed below, or by using the keyword search tool below to find specific information within the annual report.-
 1
1 -
2
-
3
-
4
-
5
-
6
-
7
-
8
-
9
-
10
-
11
-
12
-
13
-
14
-
15
-
16
-
17
-
18
-
 19
19 -
 20
20 -
 21
21 -
 22
22 -
 23
23 -
 24
24 -
 25
25 -
 26
26 -
 27
27 -
 28
28 -
 29
29 -
 30
30 -
 31
31 -
 32
32 -
 33
33 -
 34
34 -
 35
35 -
 36
36 -
 37
37 -
 38
38 -
 39
39 -
40
-
41
-
42
-
43
-
44
-
45
-
46
-
47
-
48
-
49
-
50
-
51
-
52
-
53
-
54
-
55
-
56
-
57
-
58
-
59
-
60
-
61
-
62
-
63
-
64
-
65
-
66
-
67
-
68
-
69
-
70
-
71
-
72
-
73
-
74
-
75
-
76
-
77
-
78
-
79
-
80
-
81
-
82
-
83
-
84
-
85
-
86
-
87
-
88
-
89
-
90
-
91
-
92
-
93
-
94
-
95
-
96
-
97
-
98
-
99
-
100
 |
 |

21
Item 7. Management’s Discussion and Analysis of Financial Condition and Results of Operations
General
Our fiscal year ends on the Sunday closest to September 30. The fiscal years ended on September 29, 2013, September 30,
2012 and October 2, 2011 all included 52 weeks. All references to store counts, including data for new store openings, are
reported net of related store closures, unless otherwise noted.
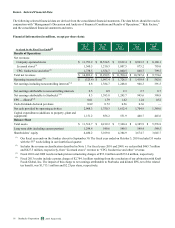
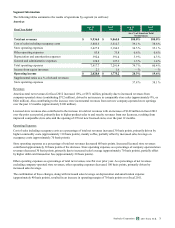
Financial Highlights
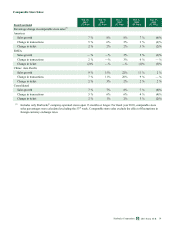
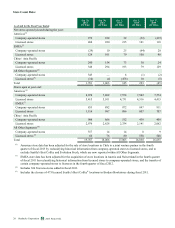
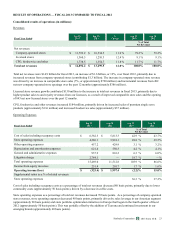
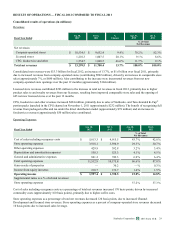
• Total net revenues increased 12.0% to $14.9 billion in fiscal 2013 compared to $13.3 billion in fiscal 2012.
• Global comparable store sales grew 7% driven by a 5% increase in the number of transactions and a 2% increase in
average ticket.
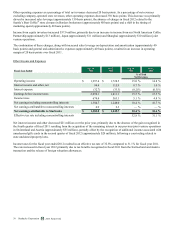
• Consolidated operating income decreased to $(0.3) billion in fiscal 2013 compared to $2.0 billion in fiscal 2012 and
fiscal 2013 operating margin was (2.2)% compared to 15.0% in fiscal 2012. The declines were due to the litigation
charge noted below.
• EPS for fiscal 2013 decreased to $0.01, compared to EPS of $1.79 in fiscal 2012. The decline was due to the litigation
charge noted below.
• Arbitration concluded on litigation with Kraft Foods Global, Inc. ("Kraft") on November 12, 2013, which resulted in a
pretax charge to fiscal 2013 operating results of $2.8 billion. This charge reduced EPS by $2.25 per share in fiscal
2013.
• Cash flow from operations was $2.9 billion in fiscal 2013 compared to $1.8 billion in fiscal 2012. Capital expenditures
were $1.2 billion in fiscal 2013 compared to $856 million in fiscal 2012.
• Available operating cash flow after capital expenditures during fiscal 2013 was directed at returning $1.2 billion of cash
to our shareholders through dividends and share repurchases.
Overview
Starbucks segment results for fiscal 2013 demonstrate the fundamental health of our global business model and our continued
ability to successfully execute new growth initiatives in a disciplined manner. Our strong revenue growth of 12% and continued
segment margin expansion drove increased operating cash flows, which allowed us to both fund our growth initiatives and
increase cash returned to shareholders through dividends and share repurchases.
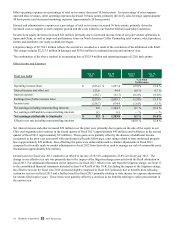
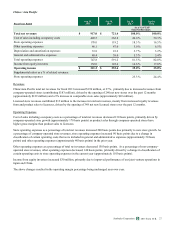
The Americas segment continued its strong performance in fiscal 2013, with revenues growing 11% and comparable store sales
growth of 7%. Strength in beverage innovation and promotions, operational improvements, and expanded food offerings all
contributed to the increase in comparable store sales. Operating margin expanded 120 basis points to 21.5%, driven by sales
leverage, store efficiencies, and lower commodity costs. Looking forward, we expect to continue to drive sales growth and
profitability through new stores and enhanced product offerings, including the continued roll out of La Boulange™ bakery items
into all of our company-operated stores by the end of fiscal 2014.
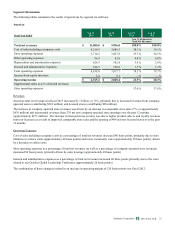
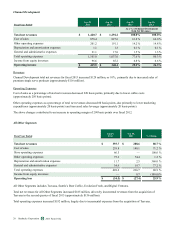
In the EMEA segment, we are continuing to make steady progress toward long-term profitability in the region. Revenues grew
2% compared to the prior year, with licensed store revenue growth nearly offset by a decline in company-operated store
revenues. This reflects the shift in our ownership structure, as we have closed underperforming company-operated stores and
are focused on growing our licensed store base in profitable locations. Comparable store sales were flat year over year, but
were modestly positive in the second half of fiscal 2013. EMEA operating margin improved to 5.5% in fiscal 2013 due to our
ongoing cost management efforts and our store portfolio optimization activities which began in the prior year. We expect the
investments we are making in this segment will result in improved operating performance as we progress on our plan towards
mid-teens operating margin over time.
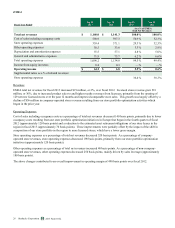
Our CAP segment results reflect a combination of rapid new store growth and solid performance from our existing store base,
including our joint venture operations in China and Japan. New store growth, along with a 9% increase in comparable store
sales, drove a 27% increase in total net revenues for fiscal 2013. Operating income grew 27% to $321 million and operating
margin was unchanged at 35%, primarily due to our rapid growth shifting away from our historically licensed model. We
expect this segment will become a more meaningful contributor to overall company profitability in the future, as we look
forward to continued store openings and establishing China as our largest market outside of the US.
2013 10-K
Starbucks Corporation Form