Starbucks 2013 Annual Report Download - page 35
Download and view the complete annual report
Please find page 35 of the 2013 Starbucks annual report below. You can navigate through the pages in the report by either clicking on the pages listed below, or by using the keyword search tool below to find specific information within the annual report.-
 1
1 -
2
-
3
-
4
-
5
-
6
-
7
-
8
-
9
-
10
-
11
-
12
-
13
-
14
-
15
-
16
-
17
-
18
-
19
-
20
-
21
-
22
-
23
-
24
-
 25
25 -
 26
26 -
 27
27 -
 28
28 -
 29
29 -
 30
30 -
 31
31 -
 32
32 -
 33
33 -
 34
34 -
 35
35 -
 36
36 -
 37
37 -
 38
38 -
 39
39 -
 40
40 -
 41
41 -
 42
42 -
 43
43 -
 44
44 -
 45
45 -
46
-
47
-
48
-
49
-
50
-
51
-
52
-
53
-
54
-
55
-
56
-
57
-
58
-
59
-
60
-
61
-
62
-
63
-
64
-
65
-
66
-
67
-
68
-
69
-
70
-
71
-
72
-
73
-
74
-
75
-
76
-
77
-
78
-
79
-
80
-
81
-
82
-
83
-
84
-
85
-
86
-
87
-
88
-
89
-
90
-
91
-
92
-
93
-
94
-
95
-
96
-
97
-
98
-
99
-
100
 |
 |
27
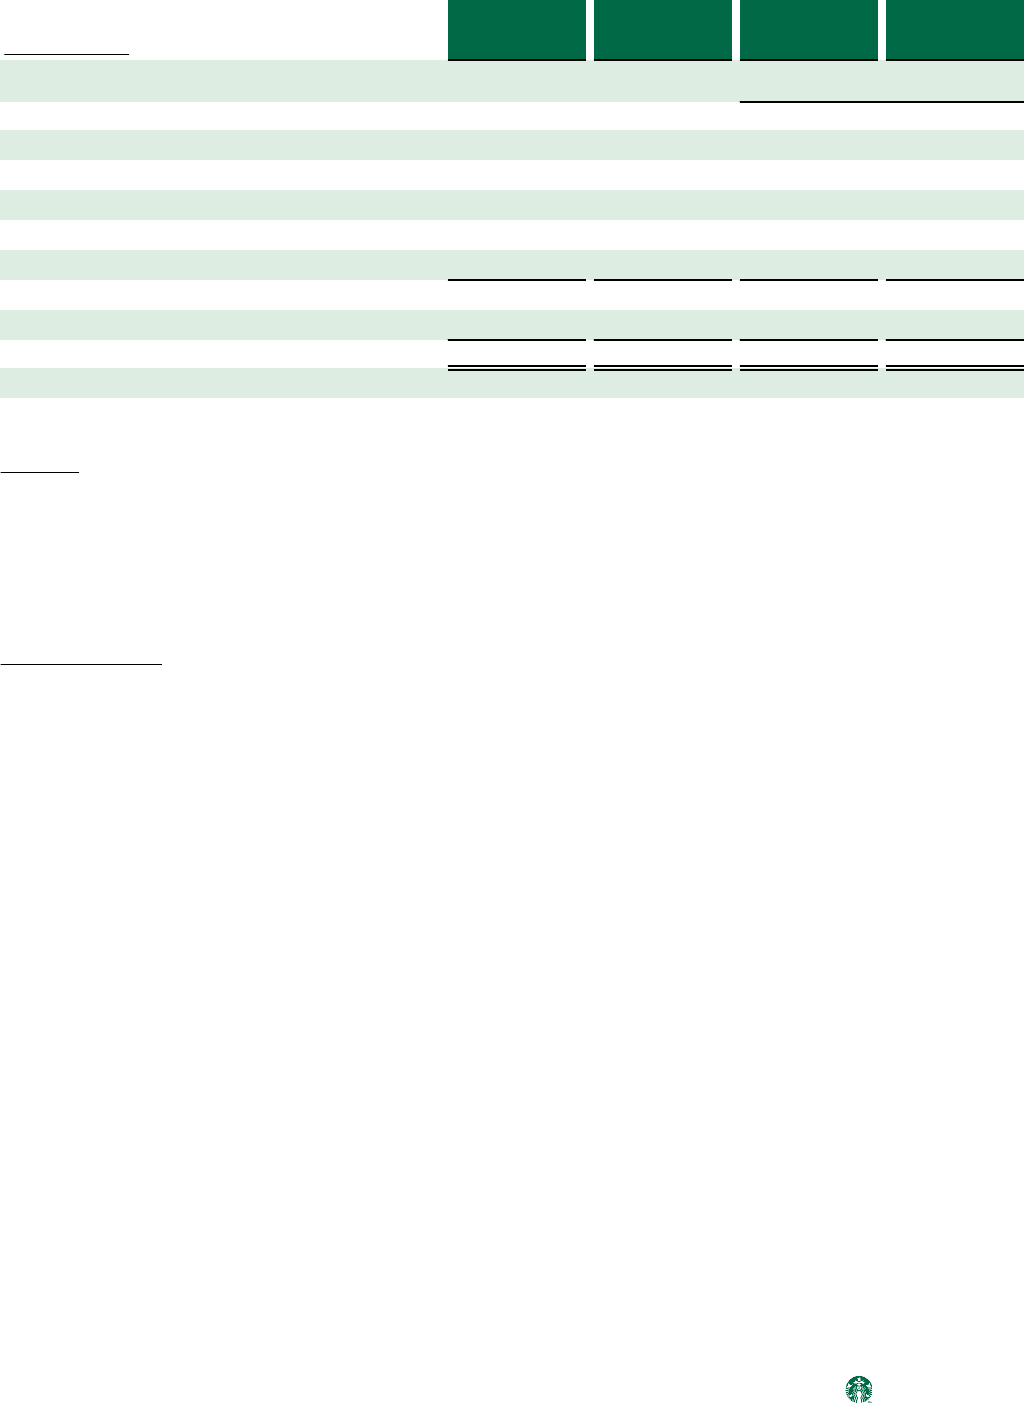
China / Asia Pacific
Fiscal Year Ended
Sep 29,
2013
Sep 30,
2012
Sep 29,
2013
Sep 30,
2012
As a % of CAP
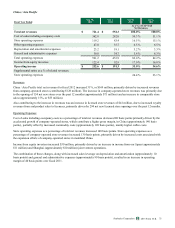
Total Net Revenues
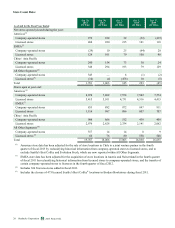
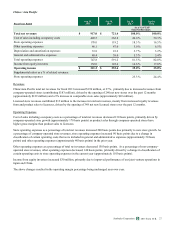
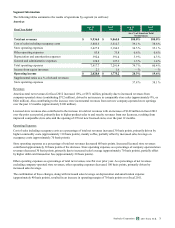
Total net revenues $ 917.0 $ 721.4 100.0% 100.0%
Cost of sales including occupancy costs 449.5 362.8 49.0 % 50.3 %
Store operating expenses 170.0 119.2 18.5 % 16.5 %
Other operating expenses 46.1 47.0 5.0 % 6.5 %
Depreciation and amortization expenses 33.8 23.2 3.7 % 3.2 %
General and administrative expenses 48.4 39.0 5.3 % 5.4 %
Total operating expenses 747.8 591.2 81.5 % 82.0 %
Income from equity investees 152.0 122.4 16.6 % 17.0 %
Operating income $ 321.2 $ 252.6 35.0% 35.0%
Supplemental ratios as a % of related revenues:
Store operating expenses 25.3 % 24.4 %
Revenues
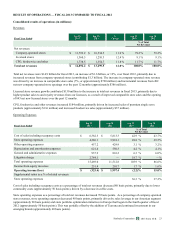
China/Asia Pacific total net revenues for fiscal 2013 increased $196 million, or 27%, primarily due to increased revenues from
company-operated stores (contributing $183 million), driven by the opening of 240 net new stores over the past 12 months
(approximately $129 million) and a 9% increase in comparable store sales (approximately $43 million).
Licensed store revenues contributed $13 million to the increase in total net revenues, mainly from increased royalty revenues
from and product sales to licensees, driven by the opening of 348 net new licensed stores over the past 12 months.
Operating Expenses
Cost of sales including occupancy costs as a percentage of total net revenues decreased 130 basis points, primarily driven by
company-operated store growth (approximately 170 basis points) as product sales through company-operated stores have
higher gross margins than product sales to licensees.
Store operating expenses as a percentage of total net revenues increased 200 basis points due primarily to new store growth. As
a percentage of company-operated store revenues, store operating expenses increased 90 basis points due to a change in
classification of certain operating costs that were included in general and administrative expenses (approximately 50 basis
points) and other operating expenses (approximately 40 basis points) in the prior year.
Other operating expenses as a percentage of total net revenues decreased 150 basis points. As a percentage of non-company-
operated store revenues, other operating expenses decreased 140 basis points, primarily driven by a change in classification of
certain operating costs to store operating expenses in the current year (approximately 110 basis points).
Income from equity investees increased $30 million, primarily due to improved performance of our joint venture operations in
Japan and China.
The above changes resulted in the operating margin percentage being unchanged year over year.
2013 10-K
Starbucks Corporation Form