Starbucks 2013 Annual Report Download - page 14
Download and view the complete annual report
Please find page 14 of the 2013 Starbucks annual report below. You can navigate through the pages in the report by either clicking on the pages listed below, or by using the keyword search tool below to find specific information within the annual report.-
 1
1 -
2
-
3
-
 4
4 -
 5
5 -
 6
6 -
 7
7 -
 8
8 -
 9
9 -
 10
10 -
 11
11 -
 12
12 -
 13
13 -
 14
14 -
 15
15 -
 16
16 -
 17
17 -
 18
18 -
 19
19 -
 20
20 -
 21
21 -
 22
22 -
 23
23 -
 24
24 -
25
-
26
-
27
-
28
-
29
-
30
-
31
-
32
-
33
-
34
-
35
-
36
-
37
-
38
-
39
-
40
-
41
-
42
-
43
-
44
-
45
-
46
-
47
-
48
-
49
-
50
-
51
-
52
-
53
-
54
-
55
-
56
-
57
-
58
-
59
-
60
-
61
-
62
-
63
-
64
-
65
-
66
-
67
-
68
-
69
-
70
-
71
-
72
-
73
-
74
-
75
-
76
-
77
-
78
-
79
-
80
-
81
-
82
-
83
-
84
-
85
-
86
-
87
-
88
-
89
-
90
-
91
-
92
-
93
-
94
-
95
-
96
-
97
-
98
-
99
-
100
 |
 |
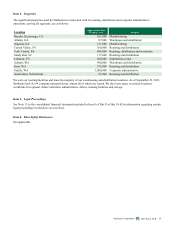
6
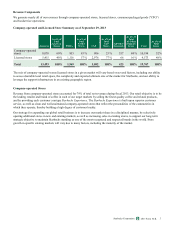
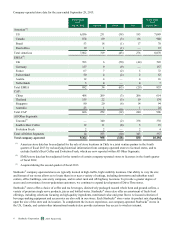
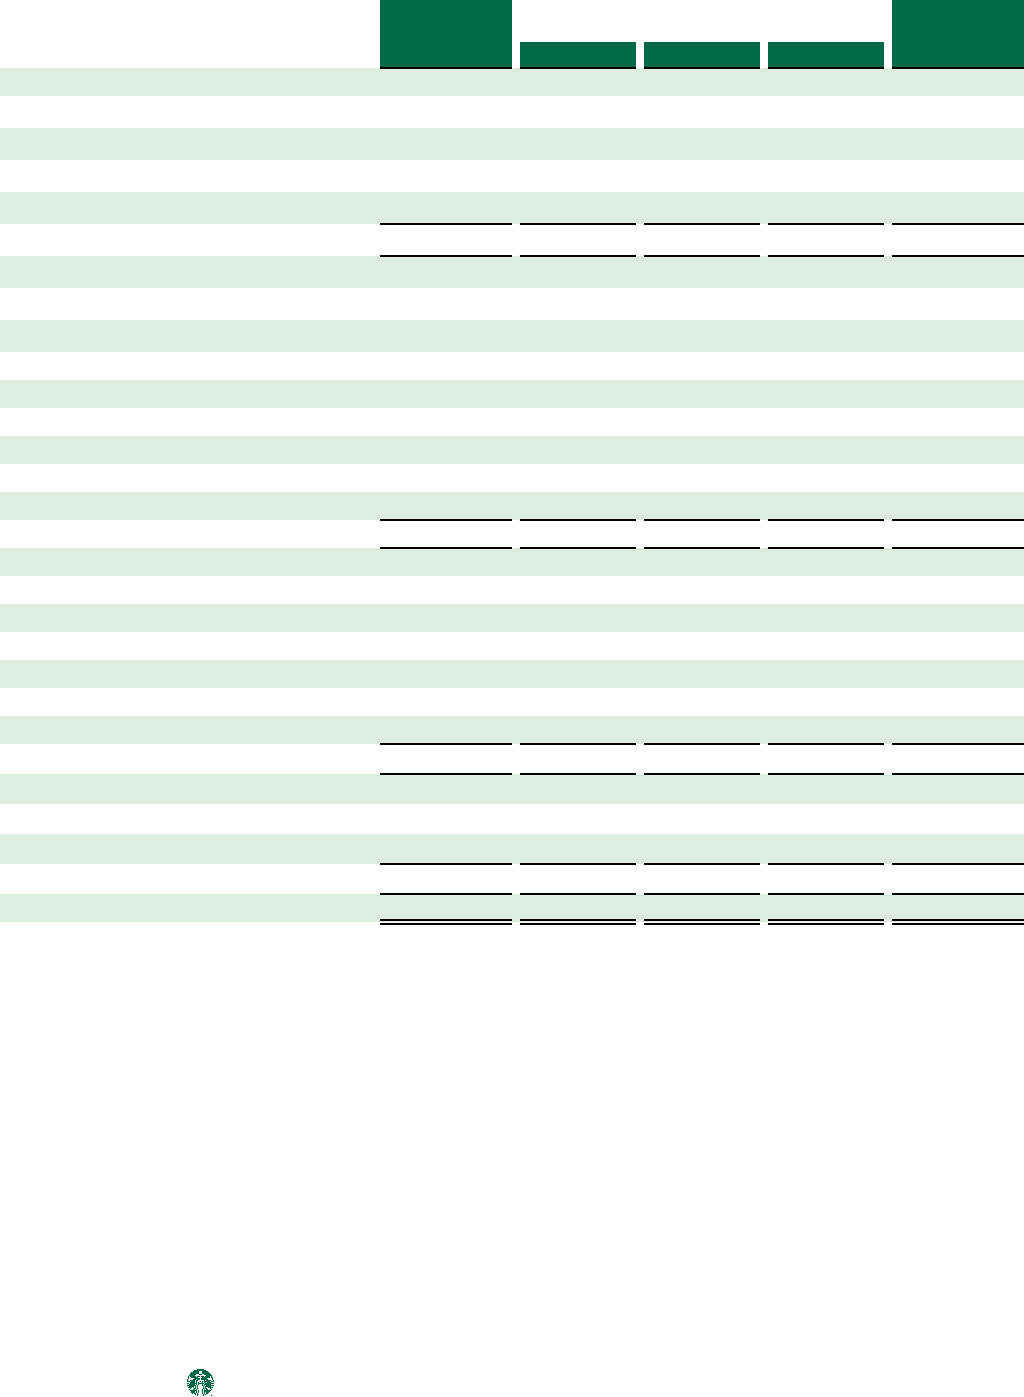
Licensed store data for the year-ended September 29, 2013:
Stores Open
as of
Stores Open
as of
Sep 30, 2012 Opened Closed Net Sep 29, 2013
Americas(1):
US 4,189 281 (62) 219 4,408
Mexico 356 48 (1) 47 403
Canada 300 98 (1) 97 397
Other 166 41 — 41 207
Total Americas 5,011 468 (64) 404 5,415
EMEA(2):
UK 168 48 (1) 47 215
Turkey 171 26 (4) 22 193
United Arab Emirates 99 9 (1) 8 107
Spain 78 4 — 4 82
Kuwait 65 6 (2) 4 69
Saudi Arabia 64 6 (8)(2) 62
Russia 60 8 (3) 5 65
Other 282 54 (13) 41 323
Total EMEA 987 161 (32) 129 1,116
CAP:
Japan 965 49 (14) 35 1,000
China 292 116 (5) 111 403
South Korea 467 108 (16) 92 559
Taiwan 271 33 (7) 26 297
Philippines 201 18 (3) 15 216
Other 432 87 (18) 69 501
Total CAP 2,628 411 (63) 348 2,976
All Other Segments:
Teavana(3) — 28 — 28 28
Seattle's Best Coffee 76 1 (39)(38) 38
Total All Other Segments 76 29 (39)(10) 66
Total licensed 8,702 1,069 (198) 871 9,573
(1) Americas store data has been adjusted for the sale of store locations in Chile to a joint venture partner in the fourth
quarter of fiscal 2013 by reclassifying historical information from company-operated stores to licensed stores, and to
exclude Seattle's Best Coffee and Evolution Fresh, which are now reported within All Other Segments.
(2) EMEA store data has been adjusted for the transfer of certain company-operated stores to licensees in the fourth quarter
of fiscal 2012.
(3) Acquired during the second quarter of fiscal 2013.
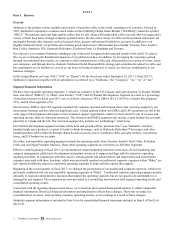
Consumer Packaged Goods
Consumer packaged goods includes both domestic and international sales of packaged coffee and tea as well as a variety of
ready-to-drink beverages and single-serve coffee and tea products to grocery, warehouse club and specialty retail stores. It also
includes revenues from product sales to and licensing revenues from manufacturers that produce and market Starbucks and
Seattle’s Best Coffee branded products through licensing agreements. Revenues from sales of consumer packaged goods
comprised 7% of total net revenues in fiscal 2013.
2013 10-K
Starbucks Corporation Form