Starbucks 2013 Annual Report Download - page 83
Download and view the complete annual report
Please find page 83 of the 2013 Starbucks annual report below. You can navigate through the pages in the report by either clicking on the pages listed below, or by using the keyword search tool below to find specific information within the annual report.-
 1
1 -
2
-
3
-
4
-
5
-
6
-
7
-
8
-
9
-
10
-
11
-
12
-
13
-
14
-
15
-
16
-
17
-
18
-
19
-
20
-
21
-
22
-
23
-
24
-
25
-
26
-
27
-
28
-
29
-
30
-
31
-
32
-
33
-
34
-
35
-
36
-
37
-
38
-
39
-
40
-
41
-
42
-
43
-
44
-
45
-
46
-
47
-
48
-
49
-
50
-
51
-
52
-
53
-
54
-
55
-
56
-
57
-
58
-
59
-
60
-
61
-
62
-
63
-
64
-
65
-
66
-
67
-
68
-
69
-
70
-
71
-
72
-
 73
73 -
 74
74 -
 75
75 -
 76
76 -
 77
77 -
 78
78 -
 79
79 -
 80
80 -
 81
81 -
 82
82 -
 83
83 -
 84
84 -
 85
85 -
 86
86 -
 87
87 -
 88
88 -
 89
89 -
 90
90 -
 91
91 -
 92
92 -
 93
93 -
94
-
95
-
96
-
97
-
98
-
99
-
100
 |
 |
75
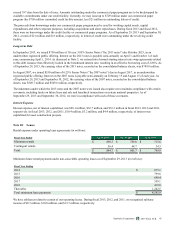
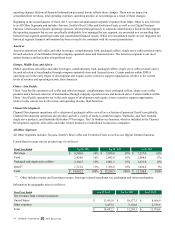
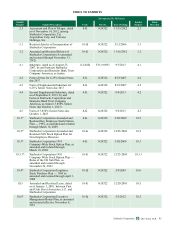
No customer accounts for 10% or more of our revenues. Revenues are shown based on the geographic location of our
customers. Revenues from countries other than the US consist primarily of revenues from Canada, the UK, and China, which
together account for approximately 64% of net revenues from other countries for fiscal 2013.
Fiscal Year Ended Sep 29, 2013 Sep 30, 2012 Oct 2, 2011
Long-lived assets:
United States $ 4,641.3 $ 2,767.1 $ 2,587.1
Other countries 1,404.0 1,252.5 978.4
Total $ 6,045.3 $ 4,019.6 $ 3,565.5
Management evaluates the performance of its operating segments based on net revenues and operating income. The accounting
policies of the operating segments are the same as those described in Note 1. Operating income represents earnings before net
interest income and other, interest expense and income taxes. Management does not evaluate the performance of its operating
segments using asset measures. The identifiable assets by segment disclosed in this note are those assets specifically
identifiable within each segment and include cash, net property, plant and equipment, equity and cost investments, goodwill,
and other intangible assets. Assets not identified by reportable operating segment below are corporate assets and are primarily
comprised of cash and investments, assets of the corporate headquarters and roasting facilities, and inventory.
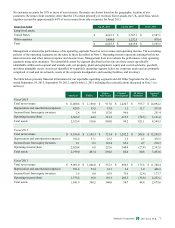
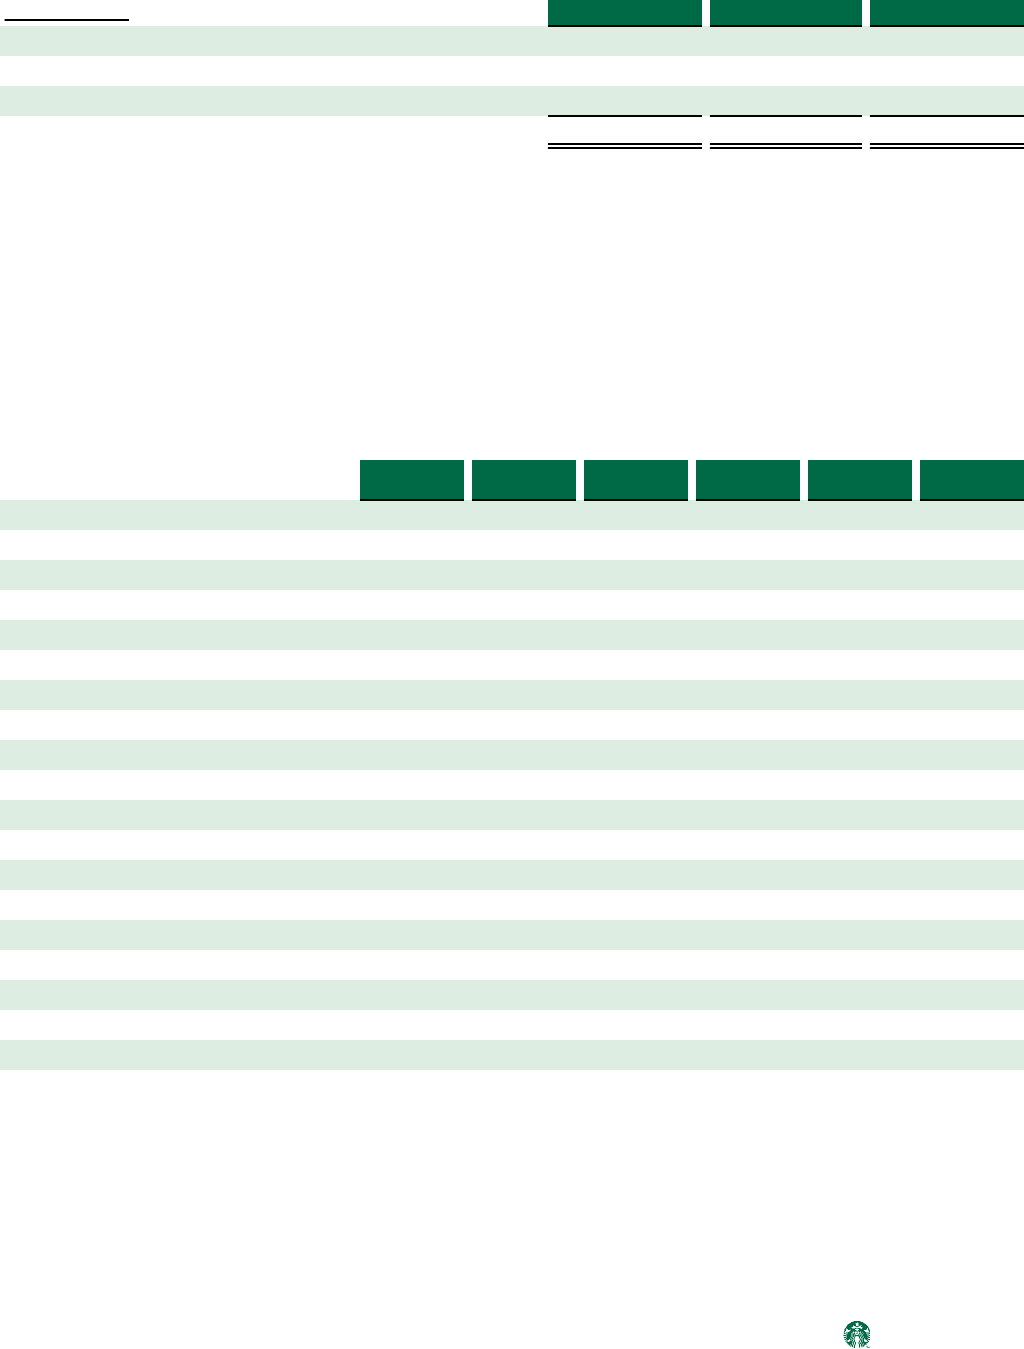
The table below presents financial information for our reportable operating segments and All Other Segments for the years
ended September 29, 2013, September 30, 2012, and October 2, 2011 including the reclassifications discussed in Note 1 (in
millions):
Americas EMEA
China /
Asia Pacific
Channel
Development
All Other
Segments
Segment
Total
Fiscal 2013
Total net revenues $ 11,000.8 $ 1,160.0 $ 917.0 $ 1,420.7 $ 393.7 $ 14,892.2
Depreciation and amortization expenses 429.3 55.5 33.8 1.1 11.7 531.4
Income/(loss) from equity investees 2.4 0.4 152.0 96.6 — 251.4
Operating income/(loss) 2,365.2 64.2 321.2 415.5 (34.5) 3,131.6
Total assets 2,323.4 510.6 805.0 89.2 821.1 4,549.3
Fiscal 2012
Total net revenues $ 9,936.0 $ 1,141.3 $ 721.4 $ 1,292.2 $ 208.6 $ 13,299.5
Depreciation and amortization expenses 392.4 57.1 23.2 1.3 2.5 476.5
Income/(loss) from equity investees 2.1 0.3 122.4 85.2 0.7 210.7
Operating income/(loss) 2,020.4 6.8 252.6 340.4 (27.4) 2,592.8
Total assets 2,199.0 467.4 656.6 88.8 80.8 3,492.6
Fiscal 2011
Total net revenues $ 9,065.0 $ 1,046.8 $ 552.3 $ 860.5 $ 175.8 $ 11,700.4
Depreciation and amortization expenses 391.4 53.4 18.1 2.4 1.0 466.3
Income/(loss) from equity investees 1.6 6.0 92.9 75.6 (2.4) 173.7
Operating income/(loss) 1,775.2 38.9 191.3 283.5 (35.8) 2,253.1
Total assets 1,841.9 398.2 540.0 54.7 44.8 2,879.6
2013 10-K
Starbucks Corporation Form