Starbucks 2014 Annual Report Download - page 10
Download and view the complete annual report
Please find page 10 of the 2014 Starbucks annual report below. You can navigate through the pages in the report by either clicking on the pages listed below, or by using the keyword search tool below to find specific information within the annual report.-
 1
1 -
 2
2 -
 3
3 -
 4
4 -
 5
5 -
 6
6 -
 7
7 -
 8
8 -
 9
9 -
 10
10 -
 11
11 -
 12
12 -
 13
13 -
 14
14 -
 15
15 -
 16
16 -
 17
17 -
 18
18 -
 19
19 -
 20
20 -
 21
21 -
22
-
23
-
24
-
25
-
26
-
27
-
28
-
29
-
30
-
31
-
32
-
33
-
34
-
35
-
36
-
37
-
38
-
39
-
40
-
41
-
42
-
43
-
44
-
45
-
46
-
47
-
48
-
49
-
50
-
51
-
52
-
53
-
54
-
55
-
56
-
57
-
58
-
59
-
60
-
61
-
62
-
63
-
64
-
65
-
66
-
67
-
68
-
69
-
70
-
71
-
72
-
73
-
74
-
75
-
76
-
77
-
78
-
79
-
80
-
81
-
82
-
83
-
84
-
85
-
86
-
87
-
88
-
89
-
90
-
91
-
92
-
93
-
94
-
95
-
96
-
97
-
98
-
99
-
100
 |
 |
6 Starbucks Corporation 2014 Form 10-K
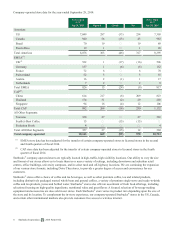
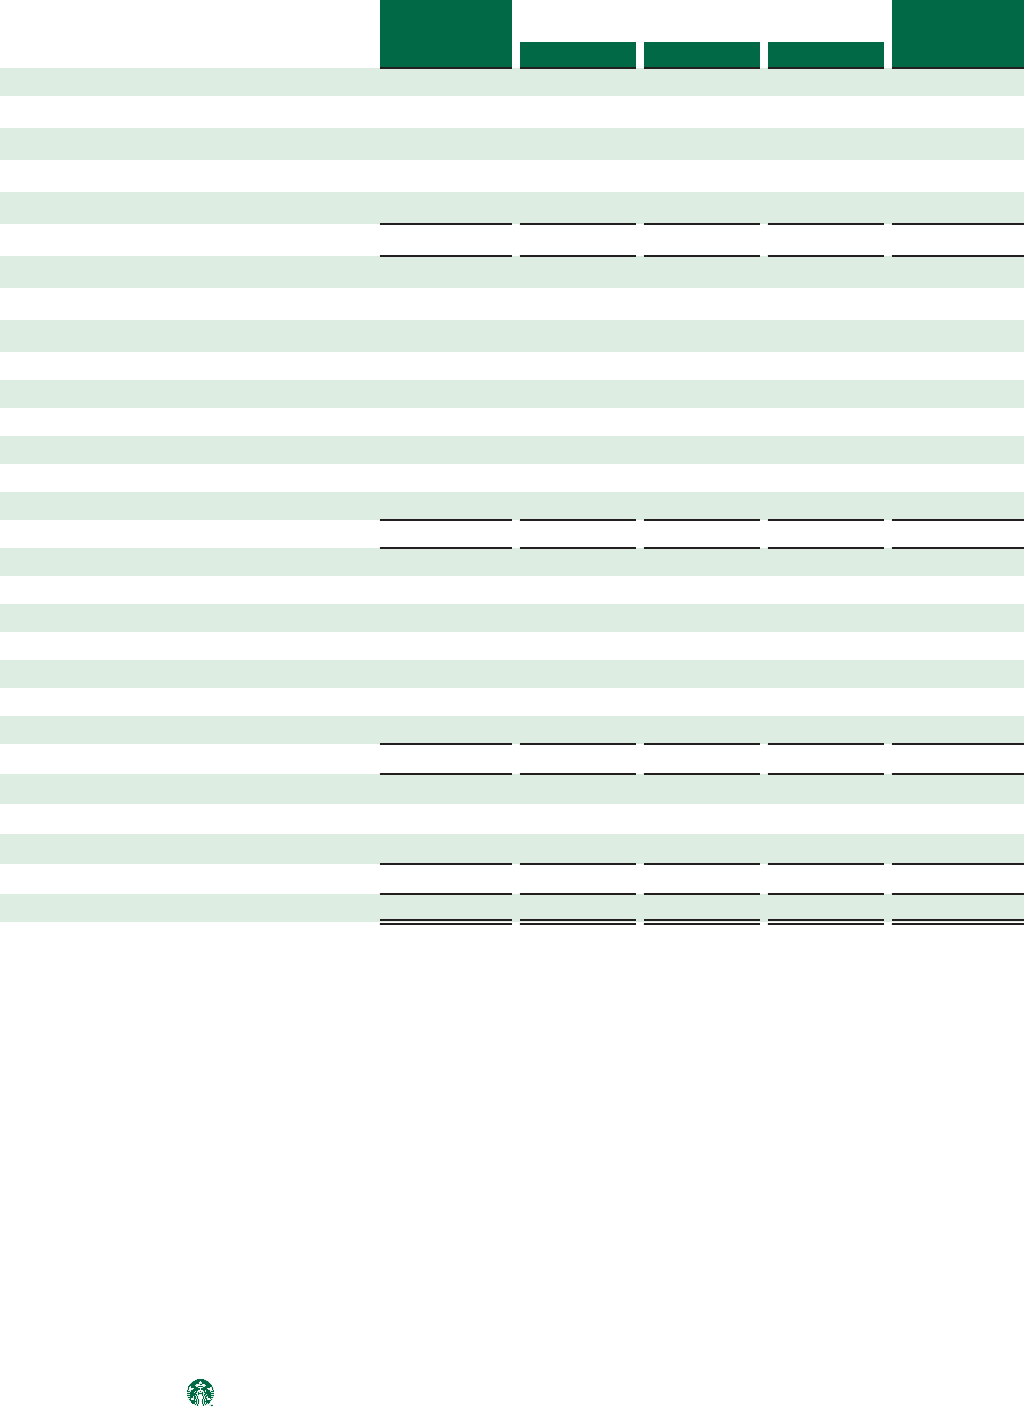
Licensed store data for the year-ended September 28, 2014:
Stores Open
as of Stores Open
as of
Sep 29, 2013 Opened Closed Net Sep 28, 2014
Americas:
US 4,408 361 (110) 251 4,659
Mexico 403 31 — 31 434
Canada 397 69 (4) 65 462
Other 207 37 (3) 34 241
Total Americas 5,415 498 (117) 381 5,796
EMEA(1):
UK(1) 242 47 (4) 43 285
Turkey 193 32 (5) 27 220
United Arab Emirates 107 12 (4) 8 115
Spain 82 5 (1) 4 86
Kuwait 69 4 (1) 3 72
Saudi Arabia 62 9 (4) 5 67
Russia 65 24 (2) 22 87
Other 323 74 (6) 68 391
Total EMEA 1,143 207 (27) 180 1,323
CAP(2):
Japan 1,000 61 (1) 60 1,060
China 403 146 (5) 141 544
South Korea 559 159 (18) 141 700
Taiwan 297 32 (6) 26 323
Philippines 216 25 (1) 24 240
Other(2) 525 117 (17) 100 625
Total CAP 3,000 540 (48) 492 3,492
All Other Segments:
Teavana 28 3 (2) 1 29
Seattle's Best Coffee 38 1 (26)(25) 13
Total All Other Segments 66 4 (28)(24) 42
Total licensed 9,624 1,249 (220) 1,029 10,653
(1) EMEA store data has been adjusted for the transfer of certain company-operated stores to licensed stores in the second
and fourth quarters of fiscal 2014.
(2) CAP store data has been adjusted for the transfer of certain company-operated stores to licensed stores in the fourth
quarter of fiscal 2014.
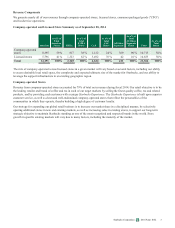
Consumer Packaged Goods
Revenues from sales of consumer packaged goods comprised 8% of total net revenues in fiscal 2014. Consumer packaged
goods includes both domestic and international sales of packaged coffee and tea as well as a variety of ready-to-drink
beverages and single-serve coffee and tea products to grocery, warehouse clubs and specialty retail stores. It also includes
revenues from product sales to and licensing revenues from manufacturers that produce and market Starbucks- and Seattle’s
Best Coffee-branded products through licensing agreements.