Starbucks 2014 Annual Report Download - page 35
Download and view the complete annual report
Please find page 35 of the 2014 Starbucks annual report below. You can navigate through the pages in the report by either clicking on the pages listed below, or by using the keyword search tool below to find specific information within the annual report.-
 1
1 -
2
-
3
-
4
-
5
-
6
-
7
-
8
-
9
-
10
-
11
-
12
-
13
-
14
-
15
-
16
-
17
-
18
-
19
-
20
-
21
-
22
-
23
-
24
-
 25
25 -
 26
26 -
 27
27 -
 28
28 -
 29
29 -
 30
30 -
 31
31 -
 32
32 -
 33
33 -
 34
34 -
 35
35 -
 36
36 -
 37
37 -
 38
38 -
 39
39 -
 40
40 -
 41
41 -
 42
42 -
 43
43 -
 44
44 -
 45
45 -
46
-
47
-
48
-
49
-
50
-
51
-
52
-
53
-
54
-
55
-
56
-
57
-
58
-
59
-
60
-
61
-
62
-
63
-
64
-
65
-
66
-
67
-
68
-
69
-
70
-
71
-
72
-
73
-
74
-
75
-
76
-
77
-
78
-
79
-
80
-
81
-
82
-
83
-
84
-
85
-
86
-
87
-
88
-
89
-
90
-
91
-
92
-
93
-
94
-
95
-
96
-
97
-
98
-
99
-
100
 |
 |

Starbucks Corporation 2014 Form 10-K 31
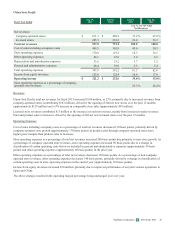
Operating Expenses
Fiscal Year Ended Sep 29,
2013 Sep 30,
2012 Sep 29,
2013 Sep 30,
2012
% of Total
Net Revenues
Cost of sales including occupancy costs $ 6,382.3 $ 5,813.3 42.9 % 43.8 %
Store operating expenses 4,286.1 3,918.1 28.8 29.5
Other operating expenses 431.8 407.2 2.9 3.1
Depreciation and amortization expenses 621.4 550.3 4.2 4.1
General and administrative expenses 937.9 801.2 6.3 6.0
Litigation charge 2,784.1 — 18.7 —
Total operating expenses 15,443.6 11,490.1 103.9 86.5
Income from equity investees 251.4 210.7 1.7 1.6
Operating income/(loss) $(325.4) $ 1,997.4 (2.2)% 15.0%
Store operating expenses as a percentage of company-
operated store revenues 36.3 % 37.2 %
Cost of sales including occupancy costs as a percentage of total net revenues decreased 90 basis points, primarily due to lower
commodity costs (approximately 50 basis points), driven by a decrease in coffee costs.
Store operating expenses as a percentage of total net revenues decreased 70 basis points. As a percentage of company-operated
store revenues, store operating expenses decreased 90 basis points, primarily driven by sales leverage in our Americas segment
(approximately 90 basis points) and store portfolio optimization initiatives in Europe that began in the fourth quarter of fiscal
2012 (approximately 50 basis points). This was partially offset by the addition of Teavana and continued investment in our
emerging brands (approximately 60 basis points).
Other operating expenses as a percentage of total net revenues decreased 20 basis points. As a percentage of non-company-
operated store revenues, other operating expenses decreased 80 basis points, primarily driven by sales leverage (approximately
50 basis points) and decreased marketing expenses (approximately 20 basis points).
General and administrative expenses as a percentage of total net revenues increased 30 basis points, primarily driven by
increased costs to support overall company growth and the costs related to our October Global Leadership Conference.
Income from equity investees increased $41 million, primarily due to increased income from of our joint venture operations in
Japan and China, as well as improved performance from our North American Coffee Partnership joint venture, which produces,
bottles and distributes our ready-to-drink beverages.
Litigation charge of $2,784.1 million reflects the accrual we recorded as a result of the conclusion of the arbitration with Kraft.
This charge includes $2,227.5 million in damages and $556.6 million in estimated interest and attorneys' fees.
The combination of the above resulted in an operating loss of $325.4 million and operating margin of (220) basis points.