Starbucks 2014 Annual Report Download - page 40
Download and view the complete annual report
Please find page 40 of the 2014 Starbucks annual report below. You can navigate through the pages in the report by either clicking on the pages listed below, or by using the keyword search tool below to find specific information within the annual report.-
 1
1 -
2
-
3
-
4
-
5
-
6
-
7
-
8
-
9
-
10
-
11
-
12
-
13
-
14
-
15
-
16
-
17
-
18
-
19
-
20
-
21
-
22
-
23
-
24
-
25
-
26
-
27
-
28
-
29
-
 30
30 -
 31
31 -
 32
32 -
 33
33 -
 34
34 -
 35
35 -
 36
36 -
 37
37 -
 38
38 -
 39
39 -
 40
40 -
 41
41 -
 42
42 -
 43
43 -
 44
44 -
 45
45 -
 46
46 -
 47
47 -
 48
48 -
 49
49 -
 50
50 -
51
-
52
-
53
-
54
-
55
-
56
-
57
-
58
-
59
-
60
-
61
-
62
-
63
-
64
-
65
-
66
-
67
-
68
-
69
-
70
-
71
-
72
-
73
-
74
-
75
-
76
-
77
-
78
-
79
-
80
-
81
-
82
-
83
-
84
-
85
-
86
-
87
-
88
-
89
-
90
-
91
-
92
-
93
-
94
-
95
-
96
-
97
-
98
-
99
-
100
 |
 |

36 Starbucks Corporation 2014 Form 10-K
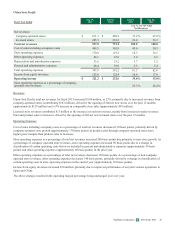
Channel Development
Fiscal Year Ended Sep 29,
2013 Sep 30,
2012 Sep 29,
2013 Sep 30,
2012
As a % of Channel Development
Total Net Revenues
Net revenues:
CPG $ 1,056.0 $ 952.1 75.5 % 74.8 %
Foodservice 342.9 320.9 24.5 25.2
Total net revenues 1,398.9 1,273.0 100.0 100.0
Cost of sales 878.4 827.6 62.8 65.0
Other operating expenses 179.4 171.9 12.8 13.5
Depreciation and amortization expenses 1.1 1.3 0.1 0.1
General and administrative expenses 21.1 17.0 1.5 1.3
Total operating expenses 1,080.0 1,017.8 77.2 80.0
Income from equity investees 96.6 85.2 6.9 6.7
Operating income $ 415.5 $ 340.4 29.7% 26.7%
Revenues
Channel Development total net revenues for fiscal 2013 increased $126 million, or 10%, primarily due to increased sales of
premium single-serve products (approximately $116 million).
Operating Expenses
Cost of sales as a percentage of total net revenues decreased 220 basis points, primarily due to lower coffee costs
(approximately 260 basis points).
Other operating expenses as a percentage of total net revenues decreased 70 basis points, due primarily to lower marketing
expenditures (approximately 20 basis points) and increased sales leverage (approximately 20 basis points).
The above changes contributed to an increase in operating margin of 300 basis points over fiscal 2012.