Starbucks 2014 Annual Report Download - page 36
Download and view the complete annual report
Please find page 36 of the 2014 Starbucks annual report below. You can navigate through the pages in the report by either clicking on the pages listed below, or by using the keyword search tool below to find specific information within the annual report.-
 1
1 -
2
-
3
-
4
-
5
-
6
-
7
-
8
-
9
-
10
-
11
-
12
-
13
-
14
-
15
-
16
-
17
-
18
-
19
-
20
-
21
-
22
-
23
-
24
-
25
-
 26
26 -
 27
27 -
 28
28 -
 29
29 -
 30
30 -
 31
31 -
 32
32 -
 33
33 -
 34
34 -
 35
35 -
 36
36 -
 37
37 -
 38
38 -
 39
39 -
 40
40 -
 41
41 -
 42
42 -
 43
43 -
 44
44 -
 45
45 -
 46
46 -
47
-
48
-
49
-
50
-
51
-
52
-
53
-
54
-
55
-
56
-
57
-
58
-
59
-
60
-
61
-
62
-
63
-
64
-
65
-
66
-
67
-
68
-
69
-
70
-
71
-
72
-
73
-
74
-
75
-
76
-
77
-
78
-
79
-
80
-
81
-
82
-
83
-
84
-
85
-
86
-
87
-
88
-
89
-
90
-
91
-
92
-
93
-
94
-
95
-
96
-
97
-
98
-
99
-
100
 |
 |

32 Starbucks Corporation 2014 Form 10-K
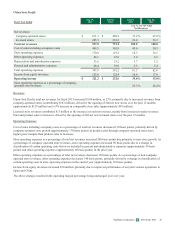
Other Income and Expenses
Fiscal Year Ended Sep 29,
2013 Sep 30,
2012 Sep 29,
2013 Sep 30,
2012
% of Total
Net Revenues
Operating income/(loss) $(325.4) $ 1,997.4 (2.2)% 15.0 %
Interest income and other, net 123.6 94.4 0.8 0.7
Interest expense (28.1)(32.7) (0.2) (0.2)
Earnings/(loss) before income taxes (229.9) 2,059.1 (1.5) 15.5
Income taxes (238.7) 674.4 (1.6) 5.1
Net earnings including noncontrolling interests 8.8 1,384.7 0.1 10.4
Net earnings attributable to noncontrolling interests 0.5 0.9 — —
Net earnings attributable to Starbucks $ 8.3 $ 1,383.8 0.1% 10.4%
Effective tax rate including noncontrolling interests 103.8 % 32.8 %
Net interest income and other increased $29 million over the prior year, primarily due to gains on the sale of the equity in our
Chile and Argentina joint ventures in the fourth quarter of fiscal 2013 (approximately $45 million) and in Mexico in the second
quarter of fiscal 2013 (approximately $35 million). These gains were partially offset by the absence of additional income
recognized in the prior year associated with unredeemed gift cards following a court ruling related to state unclaimed property
laws (approximately $29 million). Also offsetting the gains were unfavorable mark-to-market adjustments in fiscal 2013
compared to favorable mark-to-market adjustments in fiscal 2012 from derivatives used to manage our risk of commodity price
fluctuations (approximately $24 million).
Income taxes for fiscal year 2013 resulted in an effective tax rate of 103.8% compared to 32.8% for fiscal year 2012. The
change in our effective tax rate was primarily due to the impact of the litigation charge associated with the Kraft arbitration in
fiscal 2013. For additional information on the impact to our fiscal 2013 effective tax rate from the litigation charge, see Note
13, Income Taxes, to the consolidated financial statements included in Item 8 of Part II of this 10-K. Excluding the impact of
the litigation charge, the effective tax rate for fiscal year 2013 decreased slightly compared to fiscal 2012 primarily due to
benefits from releasing certain tax reserves in fiscal 2013 and a further benefit in fiscal 2013 primarily relating to state income
tax expense adjustments for returns filed in prior years. These items were partially offset by a decrease in tax benefits relating
to coffee procurement in fiscal 2013 compared to fiscal 2012.