Starbucks 2014 Annual Report Download - page 68
Download and view the complete annual report
Please find page 68 of the 2014 Starbucks annual report below. You can navigate through the pages in the report by either clicking on the pages listed below, or by using the keyword search tool below to find specific information within the annual report.-
 1
1 -
2
-
3
-
4
-
5
-
6
-
7
-
8
-
9
-
10
-
11
-
12
-
13
-
14
-
15
-
16
-
17
-
18
-
19
-
20
-
21
-
22
-
23
-
24
-
25
-
26
-
27
-
28
-
29
-
30
-
31
-
32
-
33
-
34
-
35
-
36
-
37
-
38
-
39
-
40
-
41
-
42
-
43
-
44
-
45
-
46
-
47
-
48
-
49
-
50
-
51
-
52
-
53
-
54
-
55
-
56
-
57
-
 58
58 -
 59
59 -
 60
60 -
 61
61 -
 62
62 -
 63
63 -
 64
64 -
 65
65 -
 66
66 -
 67
67 -
 68
68 -
 69
69 -
 70
70 -
 71
71 -
 72
72 -
 73
73 -
 74
74 -
 75
75 -
 76
76 -
 77
77 -
 78
78 -
79
-
80
-
81
-
82
-
83
-
84
-
85
-
86
-
87
-
88
-
89
-
90
-
91
-
92
-
93
-
94
-
95
-
96
-
97
-
98
-
99
-
100
 |
 |

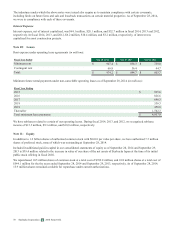
64 Starbucks Corporation 2014 Form 10-K
Fair Value Measurements at Reporting Date Using
Balance at
Sep 29, 2013
Quoted Prices
in Active
Markets for
Identical Assets
(Level 1)
Significant
Other
Observable
Inputs
(Level 2)
Significant
Unobservable
Inputs
(Level 3)
Assets:
Cash and cash equivalents $ 2,575.7 $ 2,575.7 $ — $ —
Short-term investments:
Available-for-sale securities
Agency obligations 20.0 — 20.0 —
Commercial paper 127.0 — 127.0 —
Corporate debt securities 57.5 — 57.5 —
US government treasury securities 352.9 352.9 — —
Certificates of deposit 34.1 — 34.1 —
Total available-for-sale securities 591.5 352.9 238.6 —
Trading securities 66.6 66.6 — —
Total short-term investments 658.1 419.5 238.6 —
Prepaid expenses and other current assets:
Derivative assets 12.5 — 12.5 —
Long-term investments:
Available-for-sale securities
Agency obligations 8.1 — 8.1 —
Corporate debt securities 36.8 — 36.8 —
Auction rate securities 13.4 — — 13.4
Total long-term investments 58.3 — 44.9 13.4
Other assets:
Derivative assets 11.4 — 11.4 —
Total $ 3,316.0 $ 2,995.2 $ 307.4 $ 13.4
Liabilities:
Accrued liabilities:
Derivative liabilities $ 3.5 $ — $ 3.5 $ —
Other long-term liabilities:
Derivative liabilities 0.5 — 0.5 —
Total $ 4.0 $ — $ 4.0 $ —
There were no material transfers between levels and there was no significant activity within Level 3 instruments during the
periods presented. The fair values of any financial instruments presented above exclude the impact of netting assets and
liabilities when a legally enforceable master netting agreement exists.
Available-for-sale Securities
Long-term investments (except for auction rate securities, "ARS") generally mature within 7 years. ARS have contractual
maturities ranging from 16 to 29 years and are collateralized by portfolios of student loans, substantially all of which are
guaranteed by the United States Department of Education.
Proceeds from sales of available-for-sale securities were $1.5 billion and $60.2 million for fiscal years 2014 and 2013,
respectively. Proceeds from sales of available-for-sale securities were not material in fiscal 2012. The increase in fiscal 2014
was due to the liquidation of a significant portion of our offshore investment portfolio in the fourth quarter of fiscal 2014 in
anticipation of funding the acquisition of Starbucks Japan. Realized gains and losses on sales and maturities of available-for-
sale securities were not material for fiscal years 2014, 2013, and 2012. Gross unrealized holding gains and losses on available-
for-sale securities were not material as of September 28, 2014 and September 29, 2013.