Starbucks 2014 Annual Report Download - page 83
Download and view the complete annual report
Please find page 83 of the 2014 Starbucks annual report below. You can navigate through the pages in the report by either clicking on the pages listed below, or by using the keyword search tool below to find specific information within the annual report.-
 1
1 -
2
-
3
-
4
-
5
-
6
-
7
-
8
-
9
-
10
-
11
-
12
-
13
-
14
-
15
-
16
-
17
-
18
-
19
-
20
-
21
-
22
-
23
-
24
-
25
-
26
-
27
-
28
-
29
-
30
-
31
-
32
-
33
-
34
-
35
-
36
-
37
-
38
-
39
-
40
-
41
-
42
-
43
-
44
-
45
-
46
-
47
-
48
-
49
-
50
-
51
-
52
-
53
-
54
-
55
-
56
-
57
-
58
-
59
-
60
-
61
-
62
-
63
-
64
-
65
-
66
-
67
-
68
-
69
-
70
-
71
-
72
-
 73
73 -
 74
74 -
 75
75 -
 76
76 -
 77
77 -
 78
78 -
 79
79 -
 80
80 -
 81
81 -
 82
82 -
 83
83 -
 84
84 -
 85
85 -
 86
86 -
 87
87 -
 88
88 -
 89
89 -
 90
90 -
 91
91 -
 92
92 -
 93
93 -
94
-
95
-
96
-
97
-
98
-
99
-
100
 |
 |

Starbucks Corporation 2014 Form 10-K 79
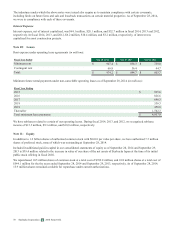
Consolidated revenue mix by product type (in millions):
Fiscal Year Ended Sep 28, 2014 Sep 29, 2013 Sep 30, 2012
Beverage $ 9,458.4 58% $ 8,674.7 58% $ 7,883.8 59%
Food 2,505.2 15% 2,189.8 15% 1,875.1 14%
Packaged and single-serve coffees and teas 2,370.0 14% 2,206.5 15% 1,965.8 15%
Other(1) 2,114.2 13% 1,795.8 12% 1,552.1 12%
Total $ 16,447.8 100% $ 14,866.8 100% $ 13,276.8 100%
(1) "Other" primarily includes royalty and licensing revenues, beverage-related ingredients, ready-to-drink beverages and
serveware, among other items.
In fiscal 2014, we moved ready-to-drink beverage revenues from the "Food" category to the "Other" category and combined
packaged and single-serve teas, which were previously included in the "Other" category, with packaged and single serve
coffees, which are now categorized as "Packaged and single-serve coffees and teas." Additionally, we revised our discount
allocation methodology to more precisely allocate sales discounts to the various revenue product categories. None of these
changes had a material impact on the composition of our revenue mix by product type. Prior period amounts have been revised
to be consistent with the current period presentation.
Information by geographic area (in millions):
Fiscal Year Ended Sep 28, 2014 Sep 29, 2013 Sep 30, 2012
Net revenues from external customers:
United States $ 12,590.6 $ 11,389.6 $ 10,154.8
Other countries 3,857.2 3,477.2 3,122.0
Total $ 16,447.8 $ 14,866.8 $ 13,276.8
No customer accounts for 10% or more of our revenues. Revenues are shown based on the geographic location of our
customers. Revenues from countries other than the US consist primarily of revenues from Canada, the UK, and China, which
together account for approximately 65% of net revenues from other countries for fiscal 2014.
Fiscal Year Ended Sep 28, 2014 Sep 29, 2013 Sep 30, 2012
Long-lived assets:
United States $ 5,135.8 $ 4,641.3 $ 2,767.1
Other countries 1,448.4 1,404.0 1,252.5
Total $ 6,584.2 $ 6,045.3 $ 4,019.6
Management evaluates the performance of its operating segments based on net revenues and operating income. The accounting
policies of the operating segments are the same as those described in Note 1, Summary of Significant Accounting Policies.
Operating income represents earnings before net interest income and other, interest expense and income taxes. Management
does not evaluate the performance of its operating segments using asset measures. The identifiable assets by segment disclosed
in this note are those assets specifically identifiable within each segment and include cash and cash equivalents, net property,
plant and equipment, equity and cost investments, goodwill, and other intangible assets. Assets not identified by reportable
operating segment below are corporate assets and are primarily comprised of cash and cash equivalents available for general
corporate purposes, investments, assets of the corporate headquarters and roasting facilities, and inventory.