Starbucks 2014 Annual Report Download - page 25
Download and view the complete annual report
Please find page 25 of the 2014 Starbucks annual report below. You can navigate through the pages in the report by either clicking on the pages listed below, or by using the keyword search tool below to find specific information within the annual report.-
 1
1 -
2
-
3
-
4
-
5
-
6
-
7
-
8
-
9
-
10
-
11
-
12
-
13
-
14
-
 15
15 -
 16
16 -
 17
17 -
 18
18 -
 19
19 -
 20
20 -
 21
21 -
 22
22 -
 23
23 -
 24
24 -
 25
25 -
 26
26 -
 27
27 -
 28
28 -
 29
29 -
 30
30 -
 31
31 -
 32
32 -
 33
33 -
 34
34 -
 35
35 -
36
-
37
-
38
-
39
-
40
-
41
-
42
-
43
-
44
-
45
-
46
-
47
-
48
-
49
-
50
-
51
-
52
-
53
-
54
-
55
-
56
-
57
-
58
-
59
-
60
-
61
-
62
-
63
-
64
-
65
-
66
-
67
-
68
-
69
-
70
-
71
-
72
-
73
-
74
-
75
-
76
-
77
-
78
-
79
-
80
-
81
-
82
-
83
-
84
-
85
-
86
-
87
-
88
-
89
-
90
-
91
-
92
-
93
-
94
-
95
-
96
-
97
-
98
-
99
-
100
 |
 |

Starbucks Corporation 2014 Form 10-K 21
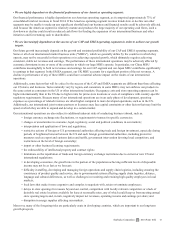
Store Count Data:
As of and for the Fiscal Year Ended
Sep 28,
2014
(52 Wks)
Sep 29,
2013
(52 Wks)
Sep 30,
2012
(52 Wks)
Oct 2,
2011
(52 Wks)
Oct 3,
2010
(53 Wks)
Net stores opened/(closed) during the year:
Americas(6)
Company-operated stores 317 276 228 32 (32)
Licensed stores 381 404 280 215 101
EMEA(7)
Company-operated stores (9)(29) 10 25 (64)
Licensed stores 180 129 101 79 100
China/Asia Pacific (8)
Company-operated stores 250 239 152 74 31
Licensed stores 492 349 296 192 78
All Other Segments (9)
Company-operated stores 12 343 — 6 (1)
Licensed stores(10) (24)(10)(4)(478) 10
Total 1,599 1,701 1,063 145 223
Stores open at year end:
Americas (6)
Company-operated stores 8,395 8,078 7,802 7,574 7,542
Licensed stores 5,796 5,415 5,011 4,731 4,516
EMEA(7)
Company-operated stores 817 826 855 845 820
Licensed stores 1,323 1,143 1,014 913 834
China/Asia Pacific(8)
Company-operated stores 1,132 882 643 491 417
Licensed stores 3,492 3,000 2,651 2,355 2,163
All Other Segments (9)
Company-operated stores 369 357 14 14 8
Licensed stores (10) 42 66 76 80 558
Total 21,366 19,767 18,066 17,003 16,858
(6) Americas store data has been adjusted for the sale of store locations in Chile to a joint venture partner in the fourth
quarter of fiscal 2013 by reclassifying historical information from company-operated stores to licensed stores, and to
exclude Seattle's Best Coffee and Evolution Fresh, which are reported within All Other Segments.
(7) EMEA store data has been adjusted for the acquisition of store locations in Austria and Switzerland in the fourth quarter
of fiscal 2011 by reclassifying historical information from licensed stores to company-operated stores, and the transfer of
certain company-operated stores to licensed stores in the fourth quarter of fiscal 2012 and in the second and fourth
quarters of fiscal 2014.
(8) CAP store data has been adjusted for the transfer of certain company-operated stores to licensed stores in the fourth
quarter of fiscal 2014.
(9) Includes 337 Teavana® stores acquired in the second quarter of fiscal 2013.
(10) Includes the closure of 475 licensed Seattle’s Best Coffee® locations in Borders Bookstores during fiscal 2011.