Starbucks 2014 Annual Report Download - page 34
Download and view the complete annual report
Please find page 34 of the 2014 Starbucks annual report below. You can navigate through the pages in the report by either clicking on the pages listed below, or by using the keyword search tool below to find specific information within the annual report.-
 1
1 -
2
-
3
-
4
-
5
-
6
-
7
-
8
-
9
-
10
-
11
-
12
-
13
-
14
-
15
-
16
-
17
-
18
-
19
-
20
-
21
-
22
-
23
-
 24
24 -
 25
25 -
 26
26 -
 27
27 -
 28
28 -
 29
29 -
 30
30 -
 31
31 -
 32
32 -
 33
33 -
 34
34 -
 35
35 -
 36
36 -
 37
37 -
 38
38 -
 39
39 -
 40
40 -
 41
41 -
 42
42 -
 43
43 -
 44
44 -
45
-
46
-
47
-
48
-
49
-
50
-
51
-
52
-
53
-
54
-
55
-
56
-
57
-
58
-
59
-
60
-
61
-
62
-
63
-
64
-
65
-
66
-
67
-
68
-
69
-
70
-
71
-
72
-
73
-
74
-
75
-
76
-
77
-
78
-
79
-
80
-
81
-
82
-
83
-
84
-
85
-
86
-
87
-
88
-
89
-
90
-
91
-
92
-
93
-
94
-
95
-
96
-
97
-
98
-
99
-
100
 |
 |

30 Starbucks Corporation 2014 Form 10-K
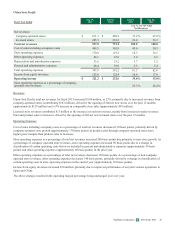
All Other Segments
Fiscal Year Ended Sep 28,
2014 Sep 29,
2013 % Change
Net revenues:
Company-operated stores $ 238.2 $ 150.4 58.4 %
Licensed stores 5.1 9.5 (46.3)
CPG, foodservice and other 253.6 230.2 10.2
Total net revenues 496.9 390.1 27.4
Cost of sales 287.2 239.8 19.8
Store operating expenses 104.5 66.5 57.1
Other operating expenses 74.6 71.7 4.0
Depreciation and amortization expenses 15.2 11.7 29.9
General and administrative expenses 42.2 34.9 20.9
Total operating expenses 523.7 424.6 23.3
Operating loss $(26.8) $ (34.5)(22.3)%
All Other Segments includes Teavana, Seattle’s Best Coffee, Evolution Fresh, and Digital Ventures.
Total net revenues for All Other Segments increased $107 million, primarily due to having an additional quarter of Teavana
revenues in fiscal 2014 as Teavana was acquired at the beginning of the second quarter of fiscal 2013 (approximately $92
million).
Total operating expenses increased $99 million, primarily due to having an additional quarter of Teavana expenses in fiscal
2014 as Teavana was acquired at the beginning of the second quarter of fiscal 2013.
RESULTS OF OPERATIONS — FISCAL 2013 COMPARED TO FISCAL 2012
Consolidated results of operations (in millions):
Revenues
Fiscal Year Ended Sep 29,
2013 Sep 30,
2012 %
Change
Net revenues:
Company-operated stores $ 11,793.2 $ 10,534.5 11.9 %
Licensed stores 1,360.5 1,210.3 12.4
CPG, foodservice and other 1,713.1 1,532.0 11.8
Total net revenues $ 14,866.8 $ 13,276.8 12.0%
Total net revenues were $14.9 billion for fiscal 2013, an increase of $1.6 billion, or 12%, over fiscal 2012, primarily due to
increased revenues from company-operated stores (contributing $1.3 billion). The increase in company-operated store revenue
was driven by an increase in comparable store sales (7%, or approximately $720 million) and incremental revenues from 492
net new company-operated store openings over the past 12 months (approximately $386 million).
Licensed store revenue growth contributed $150 million to the increase in total net revenues in fiscal 2013, primarily due to
higher product sales to and royalty revenues from our licensees, as a result of improved comparable store sales and the opening
of 843 net new licensed stores over the past 12 months.
CPG, foodservice and other revenues increased $181 million, primarily driven by increased sales of premium single-serve
products (approximately $116 million) and increased foodservice sales (approximately $35 million).