Starbucks 2014 Annual Report Download - page 70
Download and view the complete annual report
Please find page 70 of the 2014 Starbucks annual report below. You can navigate through the pages in the report by either clicking on the pages listed below, or by using the keyword search tool below to find specific information within the annual report.-
 1
1 -
2
-
3
-
4
-
5
-
6
-
7
-
8
-
9
-
10
-
11
-
12
-
13
-
14
-
15
-
16
-
17
-
18
-
19
-
20
-
21
-
22
-
23
-
24
-
25
-
26
-
27
-
28
-
29
-
30
-
31
-
32
-
33
-
34
-
35
-
36
-
37
-
38
-
39
-
40
-
41
-
42
-
43
-
44
-
45
-
46
-
47
-
48
-
49
-
50
-
51
-
52
-
53
-
54
-
55
-
56
-
57
-
58
-
59
-
 60
60 -
 61
61 -
 62
62 -
 63
63 -
 64
64 -
 65
65 -
 66
66 -
 67
67 -
 68
68 -
 69
69 -
 70
70 -
 71
71 -
 72
72 -
 73
73 -
 74
74 -
 75
75 -
 76
76 -
 77
77 -
 78
78 -
 79
79 -
 80
80 -
81
-
82
-
83
-
84
-
85
-
86
-
87
-
88
-
89
-
90
-
91
-
92
-
93
-
94
-
95
-
96
-
97
-
98
-
99
-
100
 |
 |

66 Starbucks Corporation 2014 Form 10-K
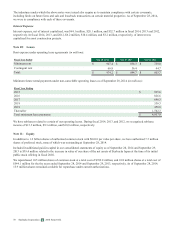
Note 6: Equity and Cost Investments (in millions)
Sep 28,
2014 Sep 29,
2013
Equity method investments $ 469.3 $ 450.9
Cost method investments 45.6 45.6
Total $ 514.9 $ 496.5
Equity Method Investments
As of September 28, 2014, we had a 50% ownership interest in each of the following international equity method investees:
Starbucks Coffee Korea Co., Ltd.; President Starbucks Coffee Corporation (Taiwan); President Starbucks Coffee (Shanghai)
Company Limited; and Tata Starbucks Limited (India). In addition, we had a 49% ownership interest in Starbucks Coffee
España, S.L. ("Starbucks Spain") and a 39.5% ownership interest in Starbucks Coffee Japan, Ltd. ("Starbucks Japan"). These
international entities operate licensed Starbucks® retail stores.
We also license the rights to produce and distribute Starbucks-branded products to our 50% owned joint venture, The North
American Coffee Partnership with the Pepsi-Cola Company, which develops and distributes bottled Starbucks® beverages,
including Frappuccino® coffee drinks, Starbucks Doubleshot® espresso drinks, Starbucks Refreshers® beverages, and Starbucks
Discoveries Iced Café Favorites®.
As of September 28, 2014, the aggregate market value of our investment in Starbucks Japan was approximately $762 million,
determined based on its available quoted market price, which exceeds its carrying value of $181 million. On October 31, 2014,
we acquired an additional 39.5% ownership interest in Starbucks Japan, converting it to a consolidated company-operated
market. See further discussion at Note 18, Subsequent Event.
In the fourth quarter of fiscal 2014, we sold our 50% equity method ownership interest in our Malaysian joint venture, Berjaya
Starbucks Coffee Company Sdn. Bhd., to our joint venture partner, Berjaya Food Berhad, for a total purchase price of $88.0
million. This transaction resulted in a gain of $67.8 million, which was included in net interest income and other in the
consolidated statements of earnings.
In the fourth quarter of fiscal 2013, we acquired a 49% equity method ownership interest in Starbucks Spain from our licensee
partner Sigla S.A. (Grupo Vips) for approximately $33 million in cash.
Our share of income and losses from our equity method investments is included in income from equity investees in the
consolidated statements of earnings. Also included in this line item is our proportionate share of gross profit resulting from
coffee and other product sales to, and royalty and license fee revenues generated from, equity investees. Revenues generated
from these related parties were $219.2 million, $205.1 million, and $190.3 million in fiscal years 2014, 2013, and 2012,
respectively. Related costs of sales were $121.2 million, $115.4 million, and $111.0 million in fiscal years 2014, 2013, and
2012, respectively. As of September 28, 2014 and September 29, 2013, there were $54.9 million and $48.3 million of accounts
receivable from equity investees, respectively, on our consolidated balance sheets, primarily related to product sales and royalty
revenues.
Summarized combined financial information of our equity method investees, which represent 100% of the investees’ financial
information (in millions):
Financial Position as of Sep 28,
2014 Sep 29,
2013
Current assets $ 701.3 $ 675.8
Noncurrent assets 873.9 783.3
Current liabilities 615.6 466.6
Noncurrent liabilities 79.1 148.9
Results of Operations for Fiscal Year Ended Sep 28,
2014 Sep 29,
2013 Sep 30,
2012
Net revenues $ 3,461.3 $ 3,018.7 $ 2,796.7
Operating income 467.7 434.8 353.5
Net earnings 382.6 358.0 286.7