Target 2002 Annual Report Download - page 18
Download and view the complete annual report
Please find page 18 of the 2002 Target annual report below. You can navigate through the pages in the report by either clicking on the pages listed below, or by using the keyword search tool below to find specific information within the annual report.-
 1
1 -
2
-
3
-
4
-
5
-
6
-
7
-
 8
8 -
 9
9 -
 10
10 -
 11
11 -
 12
12 -
 13
13 -
 14
14 -
 15
15 -
 16
16 -
 17
17 -
 18
18 -
 19
19 -
 20
20 -
 21
21 -
 22
22 -
 23
23 -
 24
24 -
 25
25 -
 26
26 -
 27
27 -
 28
28 -
29
-
30
-
31
-
32
-
33
-
34
-
35
-
36
-
37
-
38
-
39
-
40
-
41
-
42
-
43
-
44
 |
 |
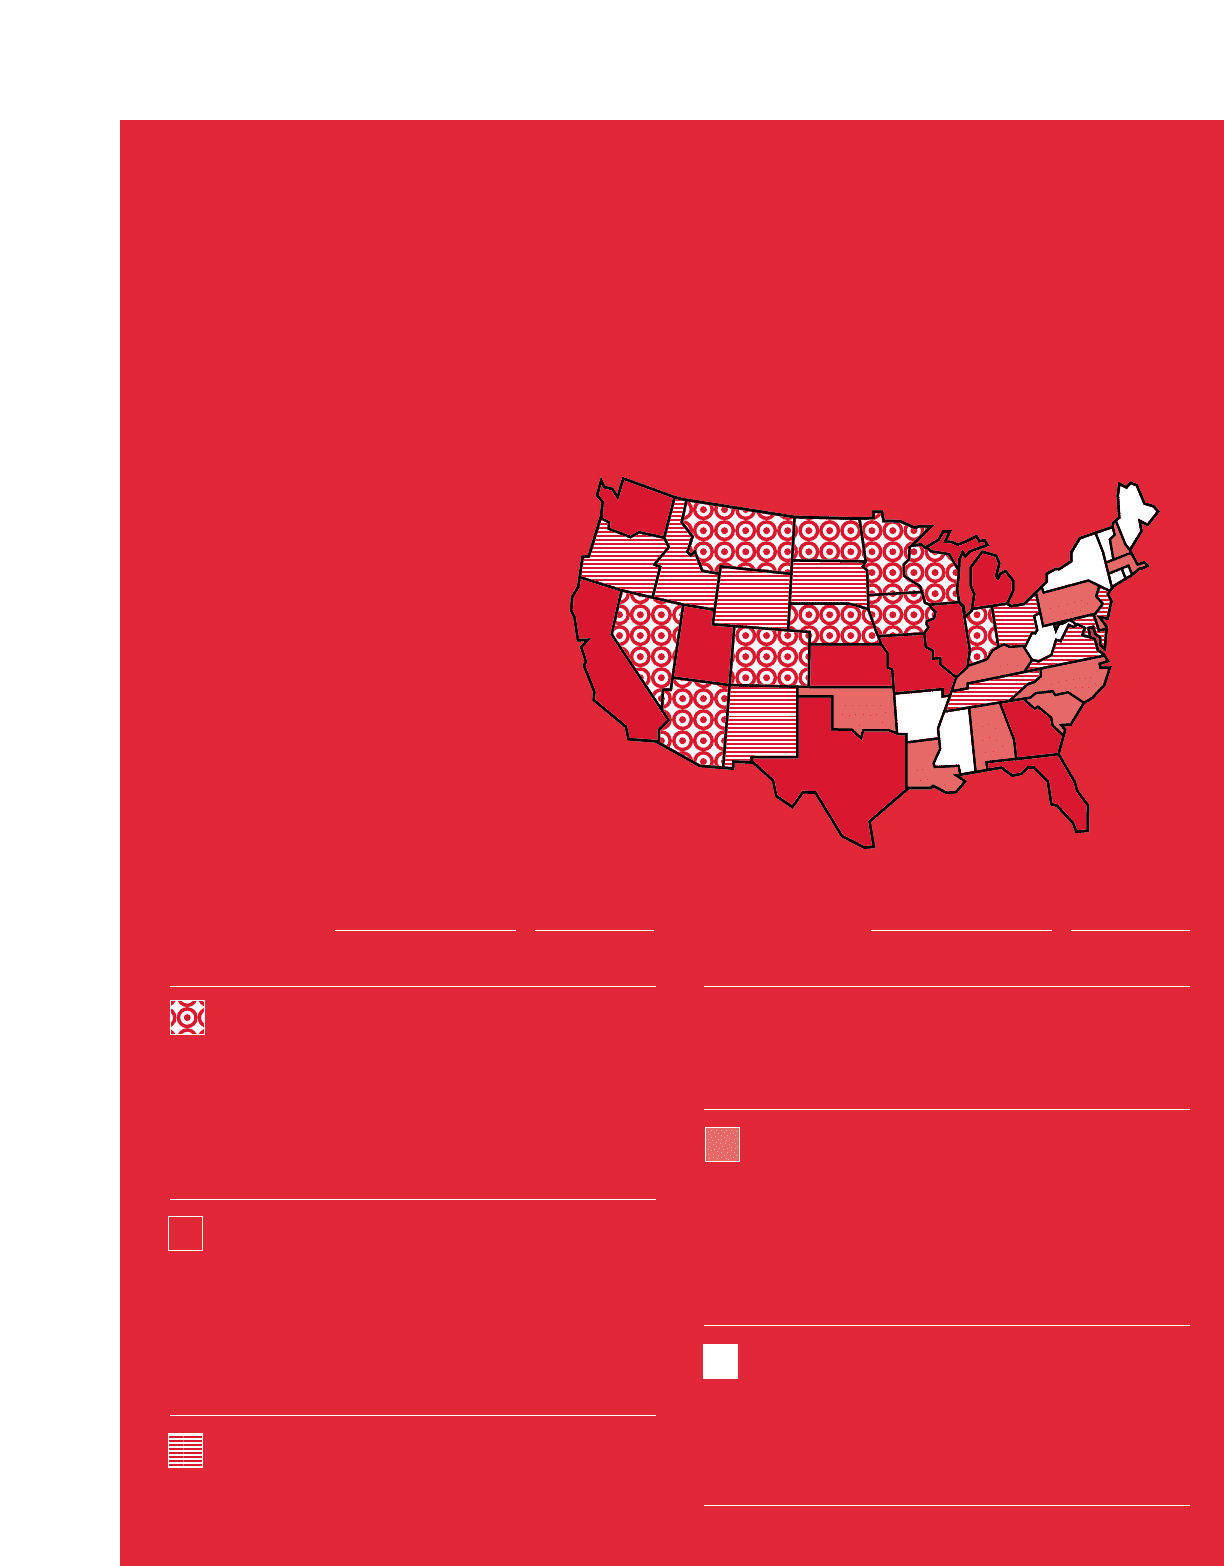
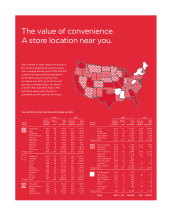
The value of convenience.
A store location near you.
Minnesota 1,594 62 7,973 1,131 5,372
Iowa 853 19 2,497 614 1,769
Colorado 802 28 3,595 592 2,352
North Dakota 793 4 505 682 437
Arizona 748 35 4,050 528 2,451
Nebraska 735 10 1,265 642 1,072
Nevada 730 13 1,584 490 841
Montana 704 6 639 344 299
Indiana 647 34 3,969 482 2,853
Wisconsin 619 29 3,358 447 2,334
Group 1 total 845 240 29,435 613 19,780
California 606 175 21,133 469 15,291
Michigan 576 52 5,765 492 4,796
Illinois 574 59 7,188 451 5,466
Texas 568 98 12,273 452 8,854
Utah 567 8 1,303 511 1,055
Georgia 555 37 4,714 366 2,795
Washington 545 29 3,293 431 2,401
Missouri 535 24 3,021 252 1,374
Kansas 531 11 1,435 423 1,109
Florida 530 73 8,823 456 6,846
Group2 total 571 566 68,948 445 49,987
Maryland 524 23 2,843 294 1,509
South Dakota 520 4 394 531 391
Oregon 504 15 1,766 363 1,174
Virginia 496 29 3,597 317 2,153
New Mexico 473 8 872 424 730
Ohio 426 41 4,842 233 2,609
Idaho 401 5 536 338 406
Tennessee 392 20 2,266 358 1,945
New Jersey 384 26 3,276 62 509
Wyoming 377 2 187 378 182
Group 3 total 445 173 20,579 263 11,608
South Carolina 354 12 1,450 102 393
Oklahoma 334 9 1,160 235 790
Delaware 334 2 268
–
0
North Carolina 326 24 2,694 285 2,161
Kentucky 323 12 1,316 287 1,129
Alabama 317 9 1,417 27 117
New Hampshire 312 3 397
–
0
Massachusetts 299 15 1,914
–
0
Louisiana 291 9 1,303 46 203
Pennsylvania 268 26 3,289
–
0
Group 4 total 307 121 15,208 100 4,793
Rhode Island 238 2 254
–
0
New York 222 32 4,214 38 717
Connecticut 189 5 649
–
0
West Virginia 139 2 250
–
0
Arkansas 131 3 354 72 186
Maine 97 1 125
–
0
Mississippi 83 2 239 42 116
Vermont
–
0 0
–
0
Group 5 total 189 47 6,085 32 1,019
Total 494 1,147 140,255 325 87,187
Year-end Store Count and Square Footage by State
Sq. Ft. per Numb er Retail Sq. Ft. pe r Reta il
Density
Thou sand of Sq. Ft. Thousand Sq. Ft.
Group
Population Stores
(in tho usands)
Population
(in tho usands)
Sq. Ft. per Number Reta il Sq. Ft. per Re tail
Density
Thou sand of Sq. Ft. Thousand Sq. Ft.
Group
Population Stores
(in tho usands)
Population
(in tho usands)
We continue to open Target stores across
the country, adding net square footage
at an average annual growth rate of 8-10%,
steadily increasing market penetration.
Since 1997, total store density has
increased over 50%. Even in our most
densely populated states, our market
presence has expanded nearly 40%,
indicating ample opportunity for
profitable growth well into the future.
2002 1997 2002 1997