Target 2002 Annual Report Download - page 20
Download and view the complete annual report
Please find page 20 of the 2002 Target annual report below. You can navigate through the pages in the report by either clicking on the pages listed below, or by using the keyword search tool below to find specific information within the annual report.-
 1
1 -
2
-
3
-
4
-
5
-
6
-
7
-
8
-
9
-
 10
10 -
 11
11 -
 12
12 -
 13
13 -
 14
14 -
 15
15 -
 16
16 -
 17
17 -
 18
18 -
 19
19 -
 20
20 -
 21
21 -
 22
22 -
 23
23 -
 24
24 -
 25
25 -
 26
26 -
 27
27 -
 28
28 -
 29
29 -
 30
30 -
31
-
32
-
33
-
34
-
35
-
36
-
37
-
38
-
39
-
40
-
41
-
42
-
43
-
44
 |
 |

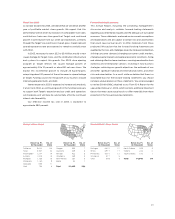
our lowest expense rate division. In 2001, our operating expense
rate improved compared to 2000, principally benefiting from the
mix impact of growth at Target.
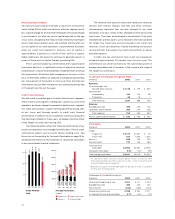
Pre-tax Segment Profit
Pre-tax segment profit increased 16.7 percent in 2002 to $3,461
million, compared with $2,965 million in 2001. The increase was
driven by growth at Target, which delivered 89 percent of
consolidated pre-tax segment profit. Marshall Field’s pre-tax segment
profit was essentially equal to last year, while Mervyn’s experienced
a decline in pre-tax segment profit compared to last year. Target’s
full-year profit margin rate increased to 8.4 percent of revenues in
2002 from 7.8 percent in 2001.
In 2001, pre-tax segment profit increased 10.6 percent to $2,965
million, compared with $2,682 million in 2000. The increase was
driven by growth at Target, which delivered 86 percent of
consolidated pre-tax segment profit. Mervyn’s also experienced an
increase in pre-tax segment profit, while Marshall Field’s experienced
a decline compared to 2000. Target’s full-year profit margin rate
increased to 7.8 percent of revenues in 2001 from 7.6 percent
in 2000.
We define pre-tax segment profit as earnings before interest,
last-in, first-out (LIFO) provision, securitization effects, other expense
and unusual items. A reconciliation of pre-tax segment profit to pre-
tax earnings is provided in the Notes to Consolidated Financial
Statements on page 35. Our segment disclosures may not be
consistent with disclosures of other companies in the same line
of business.
Pre-tax Segment Profit and as a Percent of Revenues
Pre-tax Segment Profit As a Percent of Revenues
(millions) 2002 2001 2000 2002 2001 2000
Target $3,088 $2,546 $2,223 8.4% 7.8% 7.6%
Mervyn’s 238 286 269 6.2 7.1 6.5
Marshall Field’s 135 133 190 5.0 4.8 6.4
Total pre-tax
segment
profit $3,461 $2,965 $2,682 8.0% 7.5% 7.4%
Net earnings $1,654 $1,368 $1,264
EBITDA
We provide the following EBITDA information derived from our
financial statements because we believe it provides a meaningful
aid to analysis of our performance by segment. We define segment
EBITDA as pre-tax segment profit before depreciation and
amortization expense. This presentation is not intended to be a
substitute for GAAP required measures of profitability and cash
flow. A reconciliation of pre-tax segment profit to pre-tax earnings
is provided in the Notes to Consolidated Financial Statements on
page 35. Our definition of EBITDA may differ from definitions used
by other companies.
EBITDA and as a Percent of Revenues
EBITDA As a Percent of Revenues
(millions) 2002 2001 2000 2002 2001 2000
Target $4,013 $3,330 $2,883 10.9% 10.2% 9.8%
Mervyn’s 360 412 400 9.4 10.2 9.6
Marshall Field’s 260 268 323 9.7 9.7 10.9
Total segment
EBITDA $4,633 $4,010 $3,606 10.7% 10.2% 9.9%
Segment depre-
ciation and
amortization (1,172) (1,045) (924)
Pre-tax segment
profit $3,461 $2,965 $2,682
Cash flows
provided by/
(used for):
Operating
activities $1,590 $2,012 $2,134
Investing
activities (3,189) (3,310) (2,692)
Financing
activities 1,858 1,441 694
Net increase in
cash and cash
equivalents $ 259 $ 143 $ 136
Depreciation and Amortization
In 2002, depreciation and amortization increased 12.4 percent to
$1,212 million compared to 2001. In 2001, depreciation and
amortization increased 14.8 percent to $1,079 million compared to
2000. The increase in both years is primarily due to new store
growth at Target.
Interest Expense
In 2002, interest expense was $588 million, $88 million higher than
the total of interest expense and interest equivalent in 2001. For
analytical purposes, the amounts that represented payments
accrued to holders of sold securitized receivables prior to August
22, 2001 (discussed in detail under Accounting for Accounts
Receivable on page 19) are considered as interest equivalent. After
that date such payments constituted interest expense. In 2002, $25
million of the increase in interest expense was due to the loss
resulting from the early call or repurchase of $266 million of debt.
The remaining $63 million increase in interest expense is attributable
to higher average funded balances, partially offset by the favorable
effect of lower average portfolio interest rates. The average portfolio
interest rate in 2002 was 5.6 percent compared with 6.4 percent in
2001, and 7.4 percent in 2000. In 2001, the total of interest expense
and interest equivalent was $24 million higher than in 2000 due to
higher average funded balances partially offset by the favorable
effect of lower average portfolio interest rates.
During 2002, we called or repurchased $266 million of debt
resulting in a loss of $34 million ($.02 per share). The debt called
or repurchased had a weighted average interest rate of 8.8 percent
and an average remaining life of 19 years. In 2001 and 2000, we
18