Target 2002 Annual Report Download - page 30
Download and view the complete annual report
Please find page 30 of the 2002 Target annual report below. You can navigate through the pages in the report by either clicking on the pages listed below, or by using the keyword search tool below to find specific information within the annual report.-
 1
1 -
2
-
3
-
4
-
5
-
6
-
7
-
8
-
9
-
10
-
11
-
12
-
13
-
14
-
15
-
16
-
17
-
18
-
19
-
 20
20 -
 21
21 -
 22
22 -
 23
23 -
 24
24 -
 25
25 -
 26
26 -
 27
27 -
 28
28 -
 29
29 -
 30
30 -
 31
31 -
 32
32 -
 33
33 -
 34
34 -
 35
35 -
 36
36 -
 37
37 -
 38
38 -
 39
39 -
 40
40 -
41
-
42
-
43
-
44
 |
 |

28
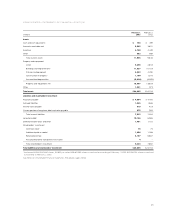
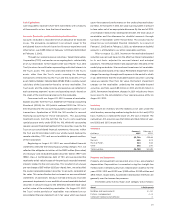
N OT E S TO C O N S O L I DAT E D F I N A N C I A L S TAT E M E N T S
Summary of Accounting Policies
Organization Target Corporation (the Corporation) is a general
merchandise retailer, comprised of three operating segments: Target,
Mervyn’s and Marshall Field’s. Target, an upscale discount chain
located in 47 states, contributed 84 percent of our 2002 total
revenues. Mervyn’s, a middle-market promotional department store
located in 14 states in the West, South and Midwest, contributed 9
percent of total revenues. Marshall Field’s (including stores formerly
named Dayton’s and Hudson’s), a traditional department store
located in 8 states in the upper Midwest, contributed 6 percent of
total revenues.
Consolidation The financial statements include the balances of the
Corporation and its subsidiaries after elimination of material
intercompany balances and transactions. All material subsidiaries
are wholly owned.
Use of Estimates The preparation of our financial statements, in
conformity with accounting principles generally accepted in the
United States, requires management to make estimates and
assumptions that affect the reported amounts in the financial
statements and accompanying notes. Actual results may differ from
those estimates.
Fiscal Year Our fiscal year ends on the Saturday nearest January 31.
Unless otherwise stated, references to years in this report relate to
fiscal years rather than to calendar years. Fiscal years 2002 and
2001 each consisted of 52 weeks. Fiscal year 2000 consisted of
53 weeks.
Reclassifications Certain prior year amounts have been reclassified
to conform to the current year presentation.
Revenues
Revenue from retail sales is recognized at the time of sale.
Commissions earned on sales generated by leased departments
are included within sales and were $33 million in 2002, $37 million
in 2001 and $33 million in 2000. Net credit card revenues are
comprised of finance charges and late fees on credit card sales, as
well as third-party merchant fees earned from the use of our Target
Visa credit card. Prior to August 22, 2001, net credit card revenues
are net of the effect of any publicly held receivable-backed securities.
The amount of our retail sales charged to our credit cards were
$5.4 billion, $5.6 billion and $5.5 billion in 2002, 2001 and 2000,
respectively.
Consideration Received from Vendors
During 2002, the Emerging Issues Task Force reached a consensus
on Issue No. 02-16, “Accounting by a Customer (Including a Reseller)
for Certain Consideration Received from a Vendor.” Under the new
guidance, cash consideration received from a vendor should be
classified as a reduction of cost of sales. If the consideration received
represents a payment for assets delivered to the vendor, it should
be classified as revenue. If the consideration is a reimbursement of
a specific, incremental, identifiable cost incurred in selling the
vendor’s product, the cost should be characterized as a reduction
of that cost incurred. The guidance is effective for fiscal periods
beginning after December 15, 2002. We do not believe the adoption
of this guidance will have a material impact on our net earnings,
cash flows or financial position.
Advertising Costs
Advertising costs, included in selling, general and administrative
expense, are expensed as incurred and were $962 million, $924
million and $824 million for 2002, 2001 and 2000, respectively.
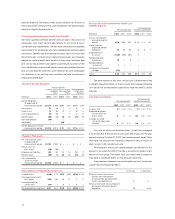
Earnings per Share
Basic earnings per share (EPS) is net earnings divided by the average
number of common shares outstanding during the period. Diluted
EPS includes the incremental shares that are assumed to be issued
on the exercise of stock options. Shares issuable upon exercise of
approximately 13.2 million options outstanding at February 1, 2003
were not included in the dilutive earnings per share calculation
because the effect would have been antidilutive. No such shares
were excluded from the dilutive earnings per share calculation at
February 2, 2002, and 3.7 million such shares were excluded at
February 3, 2001. References herein to earnings per share refer to
diluted EPS.
All earnings per share, dividends per share and common shares
outstanding reflect our 2000 two-for-one share split.
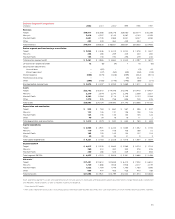
Basic EPS Diluted EPS
(millions, except
per share data)
2002
2001 2000
2002
2001 2000
Net earnings $1,654 $1,368 $1,264 $1,654 $1,368 $1,264
Basic weighted
average common
shares outstanding 908.0 901.5 903.5 908.0 901.5 903.5
Stock options –– – 6.0 8.3 9.3
Put warrants ––––– .2
Weighted average
common shares
outstanding 908.0 901.5 903.5 914.0 909.8 913.0
Earnings per share $ 1.82 $ 1.52 $ 1.40 $ 1.81 $ 1.50 $ 1.38
Other Comprehensive Income
Other comprehensive income includes revenues, expenses, gains
and losses that are excluded from net earnings under accounting
principles generally accepted in the United States. In the current
year, it primarily includes gains and losses on certain hedge
transactions, net of related taxes.