Target 2002 Annual Report Download - page 24
Download and view the complete annual report
Please find page 24 of the 2002 Target annual report below. You can navigate through the pages in the report by either clicking on the pages listed below, or by using the keyword search tool below to find specific information within the annual report.-
 1
1 -
2
-
3
-
4
-
5
-
6
-
7
-
8
-
9
-
10
-
11
-
12
-
13
-
 14
14 -
 15
15 -
 16
16 -
 17
17 -
 18
18 -
 19
19 -
 20
20 -
 21
21 -
 22
22 -
 23
23 -
 24
24 -
 25
25 -
 26
26 -
 27
27 -
 28
28 -
 29
29 -
 30
30 -
 31
31 -
 32
32 -
 33
33 -
 34
34 -
35
-
36
-
37
-
38
-
39
-
40
-
41
-
42
-
43
-
44
 |
 |
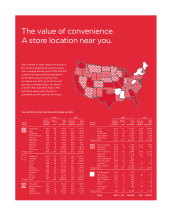
Measuring Value Creation
We measure value creation internally using a form of Economic
Value Added (EVA), which we define as after-tax segment profit
less a capital charge for all investment employed. The capital charge
is an estimate of our after-tax cost of capital adjusted for the age
of our stores, recognizing that mature stores inherently have higher
returns than newly opened stores. We estimate that the after-tax
cost of capital for our retail operations is approximately 9 percent,
while our credit card operations’ after-tax cost of capital is
approximately 5 percent as a result of their ability to support
higher debt levels. We expect to continue to generate returns in
excess of these costs of capital, thereby producing EVA.
EVA is used to evaluate our performance and to guide capital
investment decisions. A significant portion of executive incentive
compensation is tied to the achievement of targeted levels of annual
EVA generation. We believe that managing our business with a
focus on EVA helps achieve our objective of average annual earnings
per share growth of 15 percent or more over time. Earnings per
share before unusual items have grown at a compound annual rate
of 17 percent over the last five years.
Credit Card Operations
We offer credit to qualified guests in each of our business segments.
These credit card programs strategically support our core retail
operations and are an integral component of each business segment.
Our credit card products support earnings growth by driving sales
at our stores and through growth in credit card financial
performance. In addition to our proprietary credit card programs
that have been offered for many years, we began a national rollout
of the Target Visa credit card during 2001.
The following tables reflect the financial performance of our
credit card operations on a managed portfolio basis. Pre-tax credit
contribution reflects pre-tax profit before funding costs. See
discussion on Accounting for Accounts Receivable on page 19 for
additional information on the treatment of securitized receivables
in our consolidated financial statements.
The revenue from accounts receivable represents revenues
derived from finance charges, late fees and other revenues.
Intracompany merchant fees are fees charged to our retail
operations on a basis similar to fees charged by third-party credit
card issuers. These fees are eliminated in consolidation. Third-party
merchant fees are fees paid to us by merchants that have accepted
the Target Visa credit card, and are included in net credit card
revenues. Credit card expenses include marketing and account
service activities that support our credit card portfolio, as well as
bad debt expense.
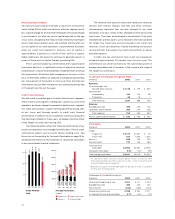
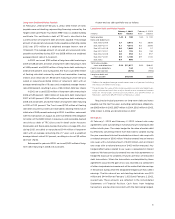
In 2002, pre-tax contribution from credit card operations
increased approximately 20 percent over the prior year. This
performance was driven primarily by the substantial growth in
average receivables due to increases in the issuance and usage of
the Target Visa credit card.
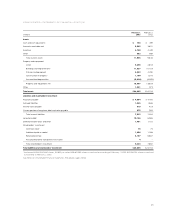
Credit Card Contribution to Segment Profit
(millions) 2002 2001 2000
Revenues:
Finance charges, late
fees and other revenues $1,126 $ 779 $ 653
Merchant fees
Intracompany 102 102 99
Third-party 69 18 1
Total revenues 1,297 899 753
Expenses:
Bad debt provision 460 230 148
Operations and marketing 305 224 205
Total expenses 765 454 353
Pre-tax credit card contribution $ 532 $ 445 $ 400
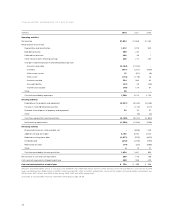
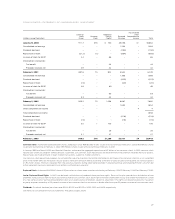
Receivables
(millions) 2002 2001 2000
Target
Target Visa $3,774 $1,567 $ 76
Guest Card 827 1,063 1,325
Mervyn’s 626 706 735
Marshall Field’s 737 756 769
Total year-end
receivables*$5,964 $4,092 $2,905
Delinquent receivables** 3.8% 3.2% 3.9
%
Total average receivables $4,841 $3,016 $2,604
*At year-end 2000, balance includes $800 million of publicly held
receivable-backed securities (see discussion under Accounting for
Accounts Receivable on page 19).
** Balances on accounts that are delinquent by 60 days or more as a percent
of total year-end receivables.
Allowance for Doubtful Accounts
(millions) 2002 2001 2000
Allowance at beginning of year $ 261 $ 211 $ 203
Bad debt provision 460 230 148
Net write-offs (322) (180) (140)
Allowance at end of year $ 399 $ 261 $ 211
As a percent of year-end receivables 6.7
%
6.4
%
7.3
%
22
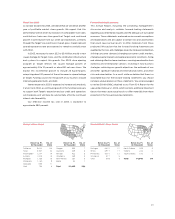
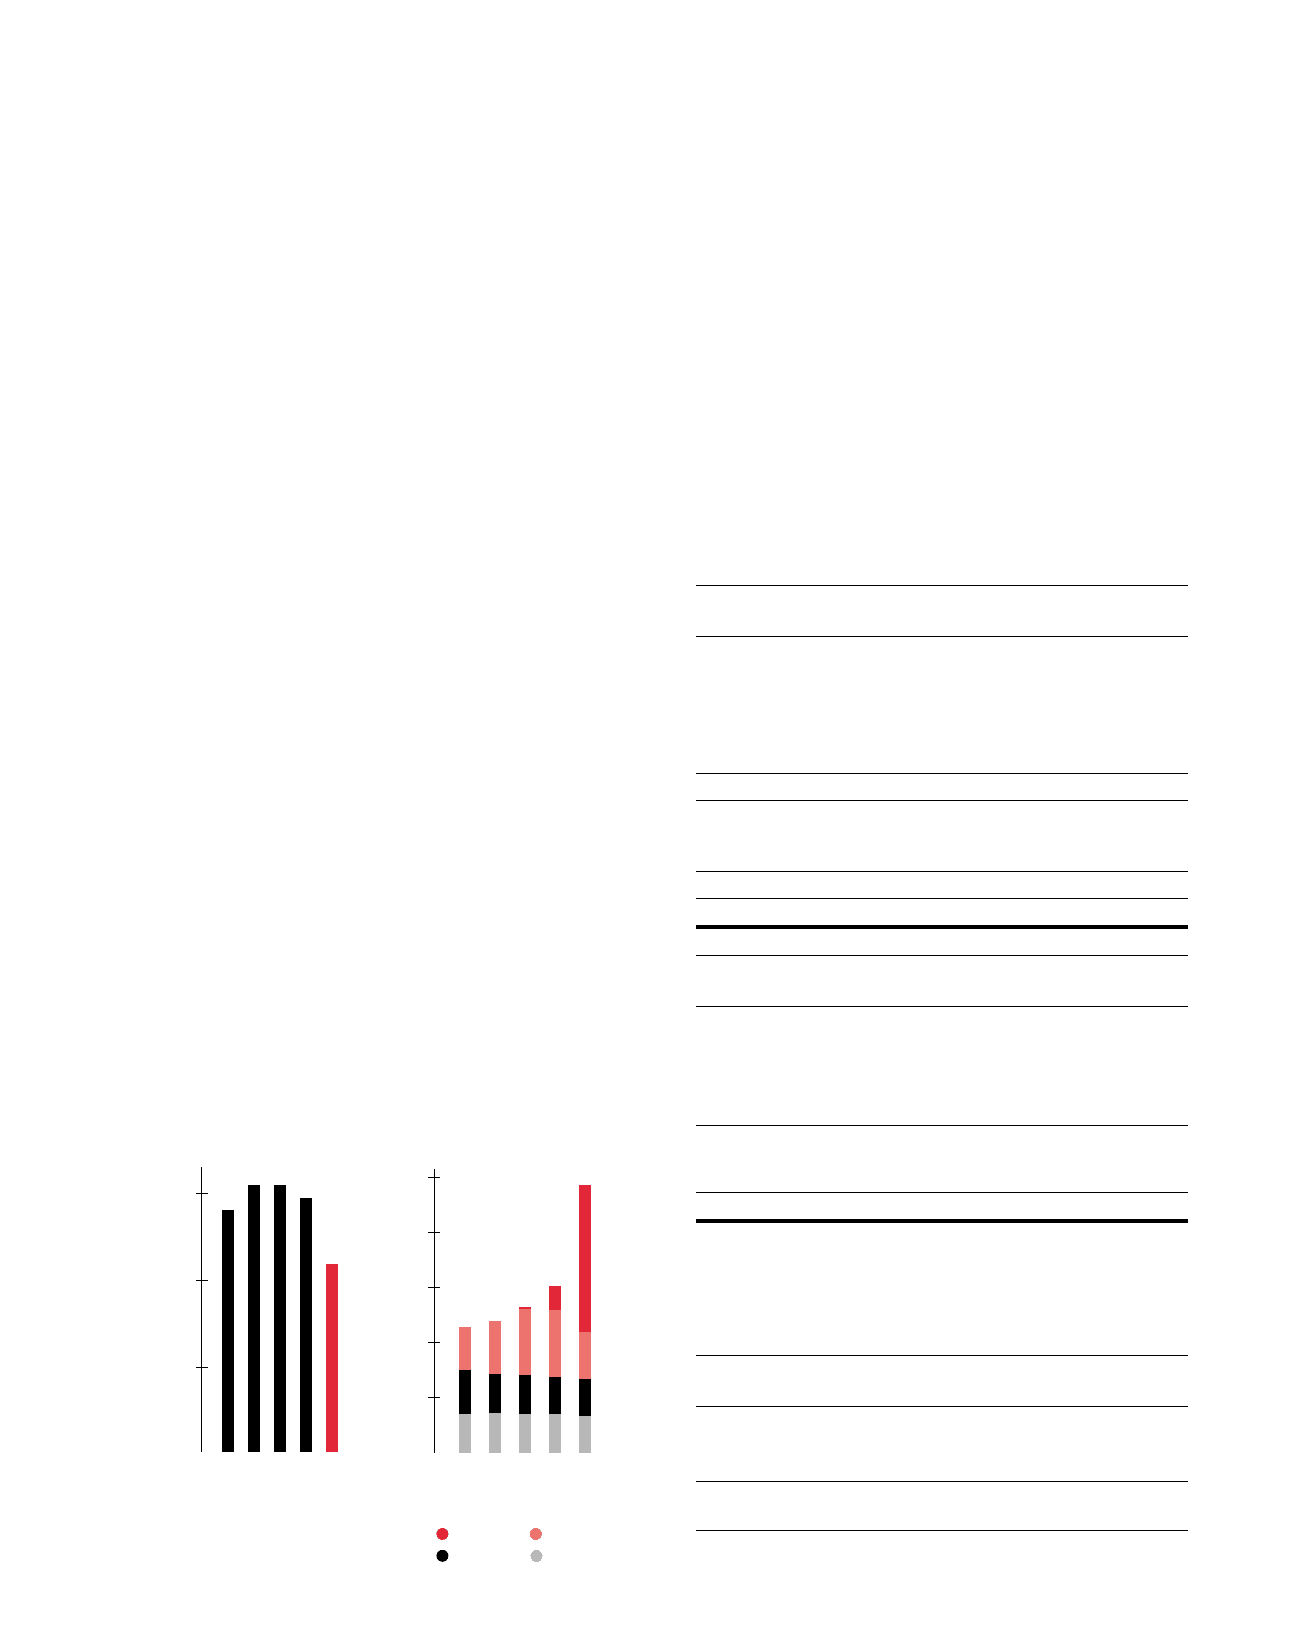
$764 $803$720
$719 $718 $974
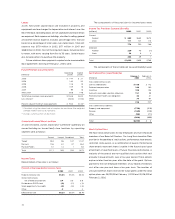
Average Receivables
(millions)
Target Visa Target Guest Card
Mervyn’s Marshall Field’s
’98 ’99 ’00 ’01 ’02
$725 $697 $1,169 $13
$725 $673 $1,218 $400
$706 $620 $880 $2,635
5,000
4,000
3,000
2,000
1,000
15.4%
Credit Portfolio
Yield
’98 ’99 ’00 ’01 ’02
14.0%
15.4%
14.7%
11.0%
15%
10%
5%