Target 2002 Annual Report Download - page 25
Download and view the complete annual report
Please find page 25 of the 2002 Target annual report below. You can navigate through the pages in the report by either clicking on the pages listed below, or by using the keyword search tool below to find specific information within the annual report.-
 1
1 -
2
-
3
-
4
-
5
-
6
-
7
-
8
-
9
-
10
-
11
-
12
-
13
-
14
-
 15
15 -
 16
16 -
 17
17 -
 18
18 -
 19
19 -
 20
20 -
 21
21 -
 22
22 -
 23
23 -
 24
24 -
 25
25 -
 26
26 -
 27
27 -
 28
28 -
 29
29 -
 30
30 -
 31
31 -
 32
32 -
 33
33 -
 34
34 -
 35
35 -
36
-
37
-
38
-
39
-
40
-
41
-
42
-
43
-
44
 |
 |
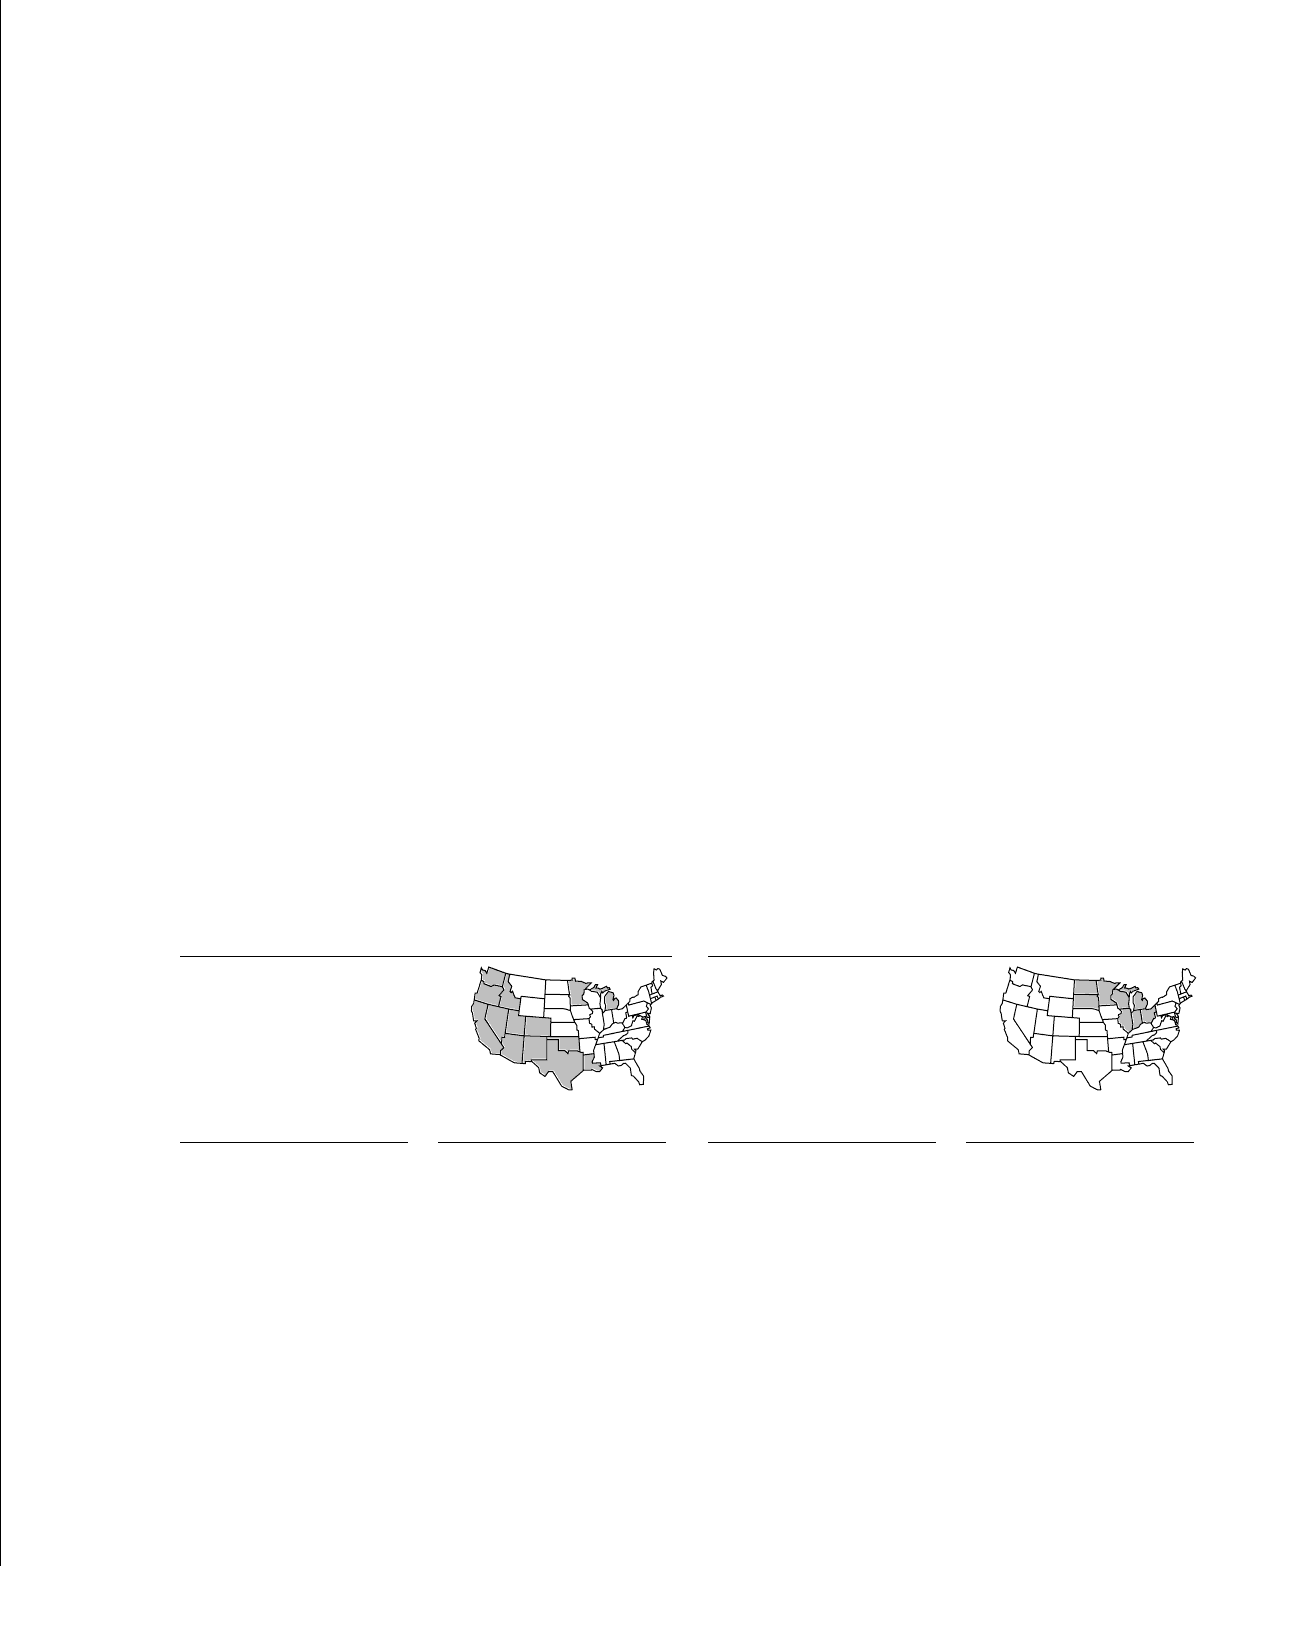
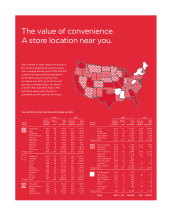
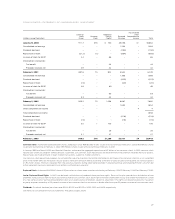
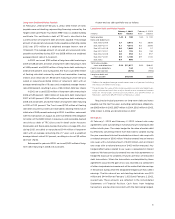
23
California 9,622 124
Texas 3,347 42
Washington 1,277 14
Arizona 1,203 15
Michigan 1,165 15
Minnesota 1,160 9
Colorado 855 11
Utah 754 8
Oregon 553 7
Louisiana 449 6
Nevada 422 6
Oklahoma 269 3
New Mexico 267 3
Idaho 82 1
Total 21,425 264
Retail Sq. Ft. No. of
(in thousands) Stores
Retail Sq. Ft. No. of
(in thousands) Stores
Michigan 4,810 21
Illinois 4,917 17
Minnesota 3,071 12
Wisconsin 817 5
Ohio 593 3
North Dakota 295 3
Indiana 242 2
South Dakota 100 1
Total 14,845 64
Retail Sq. Ft. No. of
(in thousands) Stores
Retail Sq. Ft. No. of
(in thousands) Stores
Mervyn’s Store Count Marshall Field’s Store Count
Fiscal Year 2003
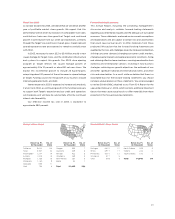
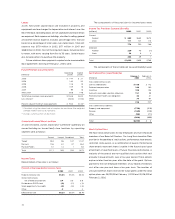
As we look forward into 2003, we believe that we will deliver another
year of profitable market share growth. We expect that this
performance will be driven by increases in comparable-store sales,
contributions from new store growth at Target, and continued
growth in contribution from our credit card operations, primarily
through the Target Visa credit card. Overall, gross margin rate and
operating expense rate are expected to remain essentially even
with 2002.
In 2003, we expect to invest $3.2 to $3.4 billion, mostly in new
square footage for Target stores, and the distribution infrastructure
and systems to support this growth. Our 2003 store opening
program at Target reflects net square footage growth of
approximately 8 to 10 percent or about 80 net new stores. We
expect this incremental growth to include 23 SuperTargets,
comprising about 30 percent of the net increase in square footage
at Target. Funding sources for the growth of our business include
internally generated funds and debt.
Interest expense in 2003 is expected to increase only modestly,
if at all, from 2002, as continued growth in the funding necessary
to support both Target’s expansion and our credit card operations
will moderate, and will likely be substantially offset by continued
interest rate favorability.
Our effective income tax rate in 2003 is expected to
approximate 38.0 percent.
Forward-looking Statements
This Annual Report, including the preceding management’s
discussion and analysis, contains forward-looking statements
regarding our performance, liquidity and the adequacy of our capital
resources. Those statements are based on our current assumptions
and expectations and are subject to certain risks and uncertainties
that could cause actual results to differ materially from those
projected. We caution that the forward-looking statements are
qualified by the risks and challenges posed by increased competition,
shifting consumer demand, changing consumer credit markets,
changing capital markets and general economic conditions, hiring
and retaining effective team members, sourcing merchandise from
domestic and international vendors, investing in new business
strategies, achieving our growth objectives, the outbreak of war
and other significant national and international events, and other
risks and uncertainties. As a result, while we believe that there is a
reasonable basis for the forward-looking statements, you should
not place undue reliance on those statements. You are encouraged
to review Exhibit (99)C attached to our Form 10-K Report for the
year-ended February 1, 2003, which contains additional important
factors that may cause actual results to differ materially from those
projected in the forward-looking statements.