Target 2002 Annual Report Download - page 37
Download and view the complete annual report
Please find page 37 of the 2002 Target annual report below. You can navigate through the pages in the report by either clicking on the pages listed below, or by using the keyword search tool below to find specific information within the annual report.-
 1
1 -
2
-
3
-
4
-
5
-
6
-
7
-
8
-
9
-
10
-
11
-
12
-
13
-
14
-
15
-
16
-
17
-
18
-
19
-
20
-
21
-
22
-
23
-
24
-
25
-
26
-
 27
27 -
 28
28 -
 29
29 -
 30
30 -
 31
31 -
 32
32 -
 33
33 -
 34
34 -
 35
35 -
 36
36 -
 37
37 -
 38
38 -
 39
39 -
 40
40 -
 41
41 -
 42
42 -
 43
43 -
 44
44
 |
 |

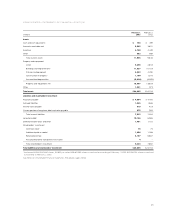
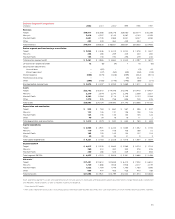
Business Segment Comparisons
(millions) 2002 2001 2000*1999 1998 1997
Revenues
Target $36,917 $32,588 $29,278 $26,080 $23,014 $20,298
Mervyn’s 3,816 4,027 4,142 4,087 4,140 4,209
Marshall Field’s 2,691 2,778 2,969 3,041 3,047 2,959
Other 493 433 462 449 434 –
Total revenues $43,917 $39,826 $36,851 $33,657 $30,635 $27,466
Pre-tax segment profit and earnings reconciliation
Target $ 3,088 $ 2,546 $ 2,223 $ 2,022 $ 1,578 $ 1,287
Mervyn’s 238 286 269 205 240 280
Marshall Field’s 135 133 190 296 279 240
Total pre-tax segment profit $ 3,461 $ 2,965 $ 2,682 $ 2,523 $ 2,097 $ 1,807
LIFO provision (expense)/credit 12 (8) (4) 7 18 (6)
Securitization adjustments:
Unusual items –(67) – – (3) 45
Interest equivalent –(27) (50) (49) (48) (33)
Interest expense (588) (473) (426) (459) (442) (501)
Mainframe outsourcing –– – (5) (42) –
Other (209) (183) (149) (148) (69) (71)
Earnings before income taxes $ 2,676 $ 2,207 $ 2,053 $ 1,869 $ 1,511 $ 1,241
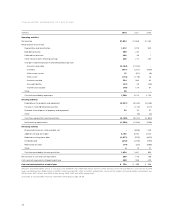
Assets
Target $22,752 $18,515 $14,348 $12,048 $10,475 $ 9,487
Mervyn’s 2,270 2,379 2,270 2,248 2,339 2,281
Marshall Field’s 2,202 2,284 2,114 2,149 2,123 2,188
Other 1,379 976 758 698 729 235
Total assets $28,603 $24,154 $19,490 $17,143 $15,666 $14,191
Depreciation and amortization
Target $ 925 $ 784 $ 660 $ 567 $ 496 $ 437
Mervyn’s 122 126 131 138 138 126
Marshall Field’s 125 135 133 133 135 128
Other 40 34 16 16 11 2
Total depreciation and amortization $ 1,212 $ 1,079 $ 940 $ 854 $ 780 $ 693
Capital expenditures
Target $ 2,966 $ 2,901 $ 2,244 $ 1,665 $ 1,352 $ 1,155
Mervyn’s 110 104 106 108 169 72
Marshall Field’s 105 125 143 124 127 124
Other 40 33 35 21 9 3
Total capital expenditures $ 3,221 $ 3,163 $ 2,528 $ 1,918 $ 1,657 $ 1,354
Segment EBITDA
Target $ 4,013 $ 3,330 $ 2,883 $ 2,589 $ 2,074 $ 1,724
Mervyn’s 360 412 400 343 378 406
Marshall Field’s 260 268 323 429 414 368
Total segment EBITDA $ 4,633 $ 4,010 $ 3,606 $ 3,361 $ 2,866 $ 2,498
Net assets**
Target $17,491 $13,812 $10,659 $ 8,413 $ 7,302 $ 6,602
Mervyn’s 1,749 1,868 1,928 1,908 2,017 2,019
Marshall Field’s 1,822 1,764 1,749 1,795 1,785 1,896
Other 636 477 463 428 470 169
Total net assets $21,698 $17,921 $14,799 $12,544 $11,574 $10,686
Each operating segment’s assets and operating results include accounts receivable and receivable-backed securities held by Target Receivables Corporation
and Retailers National Bank, as well as related income and expense.
*Consisted of 53 weeks.
** Net assets represent total assets (including publicly held receivable-backed securities) less cash equivalents and non-interest bearing current liabilities.
35