Target 2002 Annual Report Download - page 39
Download and view the complete annual report
Please find page 39 of the 2002 Target annual report below. You can navigate through the pages in the report by either clicking on the pages listed below, or by using the keyword search tool below to find specific information within the annual report.-
 1
1 -
2
-
3
-
4
-
5
-
6
-
7
-
8
-
9
-
10
-
11
-
12
-
13
-
14
-
15
-
16
-
17
-
18
-
19
-
20
-
21
-
22
-
23
-
24
-
25
-
26
-
27
-
28
-
 29
29 -
 30
30 -
 31
31 -
 32
32 -
 33
33 -
 34
34 -
 35
35 -
 36
36 -
 37
37 -
 38
38 -
 39
39 -
 40
40 -
 41
41 -
 42
42 -
 43
43 -
 44
44
 |
 |

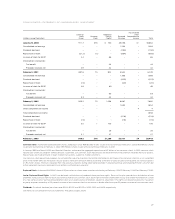
37
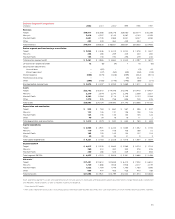
(dollars and shares outstanding in millions, except per share data) 2002 2001 2000(a) 1999 1998 1997
Results of operations
Total revenues $43,917 39,826 36,851 33,657 30,635 27,466
Net earnings (c) (d) $ 1,654 1,368 1,264 1,144 935 751
Financial position data
Total assets $28,603 24,154 19,490 17,143 15,666 14,191
Long-term debt $10,186 8,088 5,634 4,521 4,452 4,425
Per common share data (b)
Diluted earnings per share (c) (d) $ 1.81 1.50 1.38 1.23 .99 .80
Cash dividends declared $ .240 .225 .215 .200 .185 .170
Other data
Weighted average common shares outstanding (b) 908.0 901.5 903.5 882.6 880.0 872.2
Diluted average common shares outstanding (b) 914.0 909.8 913.0 931.3 934.6 927.3
Capital expenditures $ 3,221 3,163 2,528 1,918 1,657 1,354
Number of stores:
Target 1,147 1,053 977 912 851 796
Mervyn’s 264 264 266 267 268 269
Marshall Field’s 64 64 64 64 63 65
Total stores 1,475 1,381 1,307 1,243 1,182 1,130
Total retail square footage (thousands):
Target 140,255 125,245 112,975 102,978 94,586 87,187
Mervyn’s 21,425 21,425 21,555 21,635 21,729 21,810
Marshall Field’s 14,845 14,954 14,892 14,784 14,615 14,815
Total retail square footage 176,525 161,624 149,422 139,397 130,930 123,812
(a) Consisted of 53 weeks.
(b) Earnings per share, dividends per share and common shares outstanding reflect our 2000 and 1998 two-for-one common share splits.
(c) 1999 included a mainframe outsourcing pre-tax charge of $5 million (less than $.01 per share). 1998 included a mainframe outsourcing pre-tax charge
of $42 million ($.03 per share) and the beneficial effect of $20 million ($.02 per share) of the favorable outcome of our inventory shortage tax matter.
(d) 2001 included a $67 million pre-tax charge ($.05 per share) that relates to the required adoption of a new accounting standard applicable to securitized
accounts receivable (discussed in detail under Accounts Receivable and Receivable-backed Securities on page 29). 1998 included a $3 million pre-tax
net loss (less than $.01 per share) related to securitization maturity and sale transactions. 1997 included a $45 million pre-tax gain ($.03 per share) related
to securitization sale transactions.
The Summary Financial and Operating Data should be read in conjunction with the Notes to Consolidated Financial Statements throughout pages 28-36.
S U M M A R Y F I N A N C I A L A N D O P E R AT I N G DATA ( U N AU D I T E D)