Target 2002 Annual Report Download - page 23
Download and view the complete annual report
Please find page 23 of the 2002 Target annual report below. You can navigate through the pages in the report by either clicking on the pages listed below, or by using the keyword search tool below to find specific information within the annual report.-
 1
1 -
2
-
3
-
4
-
5
-
6
-
7
-
8
-
9
-
10
-
11
-
12
-
 13
13 -
 14
14 -
 15
15 -
 16
16 -
 17
17 -
 18
18 -
 19
19 -
 20
20 -
 21
21 -
 22
22 -
 23
23 -
 24
24 -
 25
25 -
 26
26 -
 27
27 -
 28
28 -
 29
29 -
 30
30 -
 31
31 -
 32
32 -
 33
33 -
34
-
35
-
36
-
37
-
38
-
39
-
40
-
41
-
42
-
43
-
44
 |
 |
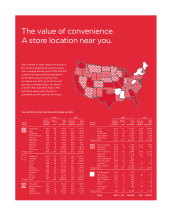
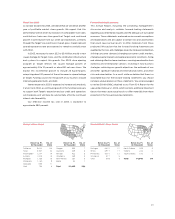
Number of Stores
February 2, February1,
2002
Opened
Closed 2003
Target 1,053 114 20 1,147
Mervyn’s 264 1 1 264
Marshall Field’s 64 0 0 64
Total 1,381 115 21 1,475
Other capital investments were for information system
hardware and software, distribution capacity and other infrastructure
to support store growth, primarily at Target.
In January 1999 and March 2000, our Board of Directors
authorized the aggregate repurchase of $2 billion of our common
stock. Since that time, we have repurchased a total of 41 million
shares of our common stock at a total cost of $1,199 million ($29.27
per share), net of the premium from exercised and expired put
options. In 2001, common stock repurchases were essentially
suspended. Consequently, common stock repurchases did not
have a material impact on our 2002 or 2001 net earnings and
financial position.
Our financing strategy is to ensure liquidity and access to
capital markets, to manage the amount of floating-rate debt and
to maintain a balanced spectrum of debt maturities. Within these
parameters, we seek to minimize our cost of borrowing.
A key to our access to liquidity and capital markets is
maintaining strong investment-grade debt ratings.
Credit Ratings
Standard
Moody’s and Poor’s Fitch
Long-term debt A2 A+ A
Commercial paper P-1 A-1 F1
Securitized receivables Aaa AAA N/A
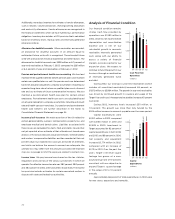
We view interest coverage and debt ratio as important
indicators of our creditworthiness. In 2002, interest coverage
continued to improve to 5.1x and debt ratio remained constant at
52 percent.
Interest Coverage and Debt Ratio
2002 2001 2000
Interest coverage 5.1x 4.7x 4.4x
Debt ratio 52% 52% 52%
Interest coverage and debt ratio include the impact of any publicly held
receivable-backed securities and off-balance sheet operating leases as if
they were debt. Interest coverage represents the ratio of pre-tax earnings
before unusual items and fixed charges to fixed charges (interest expense
excluding loss on debt repurchase, interest equivalent and the interest portion
of rent expense). Debt ratio represents the ratio of debt (debt and debt
equivalents less cash equivalents) to total capitalization, including debt,
deferred income taxes and other, and shareholders’ investment.
Further liquidity is provided by $1.9 billion of committed lines
of credit obtained through a group of 30 banks. Of these credit
lines, a $1.1 billion credit facility matures in June 2003 but includes
a one-year term-out option to June 2004. The remaining $800
million credit facility matures in June 2005. There were no balances
outstanding at any time during 2002 or 2001 under these
agreements. No debt instrument contains provisions requiring
acceleration of payment upon a debt rating downgrade.
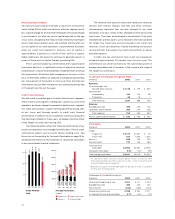
Commitments and Contingencies
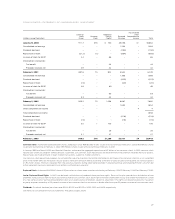
At February 1, 2003, our debt and lease contractual obligations
were as follows:
Payments Due by Period
(millions) Less than 1-3 3-5 After 5
Contractual Obligations Total 1 Year Years Years Years
Long-term debt*$10,890 $ 965 $1,359 $2,075 $6,491
Capital lease
obligations** 244 21 39 36 148
Operating leases** 1,528 147 265 208 908
Total contractual
cash obligations $12,662 $1,133 $1,663 $2,319 $7,547
*Required principal payments only. Excludes SFAS No. 133, “Accounting for
Derivative Instruments and Hedging Activities,” adjustments recorded in
long-term debt.
**Total contractual lease payments.
Commitments for the purchase, construction, lease or
remodeling of real estate, facilities and equipment were
approximately $509 million at year-end 2002.
We are exposed to claims and litigation arising out of the
ordinary course of business. Management, after consulting with
legal counsel, believes the currently identified claims and litigation
will not have a material adverse effect on our results of operations
or our financial condition taken as a whole.
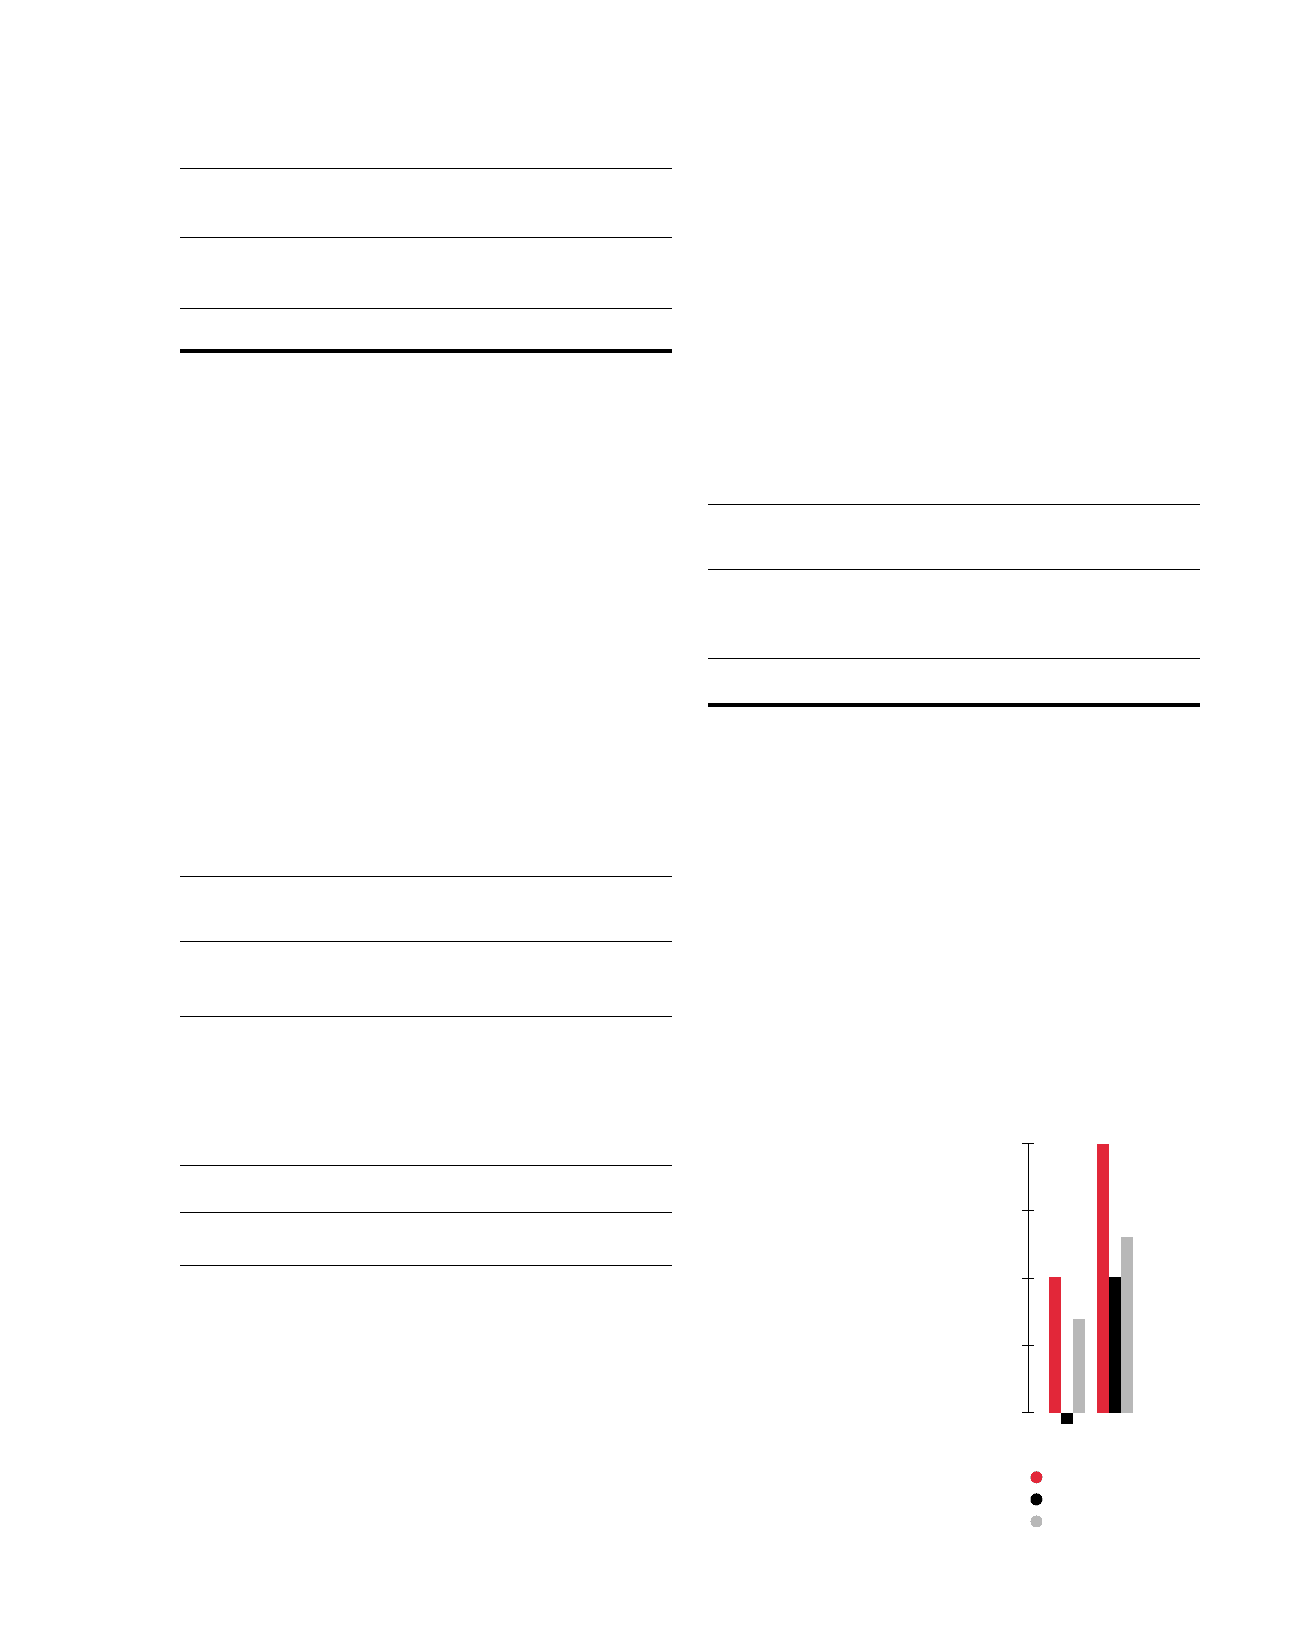
Performance Objectives
Shareholder Return
Our primary objective is to maxi-
mize shareholder value over time
through a combination of share
price appreciation and dividend
income while maintaining a
prudent and flexible capital
structure. Our total return to
shareholders (including reinvested
dividends) over the last five years
averaged 10.2 percent annually,
returning about $162 for each $100
invested in our stock at the
beginning of this period.
21
10%
-1%
7%
Total Annualized Return
Target
S&P 500
Proxy peer group
5Year 10Year
20%
10%
13%
20
15
10
5
0