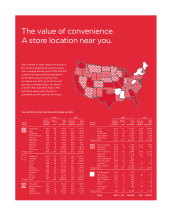
Target 2002 Annual Report Download - page 19
Download and view the complete annual report
Please find page 19 of the 2002 Target annual report below. You can navigate through the pages in the report by either clicking on the pages listed below, or by using the keyword search tool below to find specific information within the annual report.-
 1
1 -
2
-
3
-
4
-
5
-
6
-
7
-
8
-
 9
9 -
 10
10 -
 11
11 -
 12
12 -
 13
13 -
 14
14 -
 15
15 -
 16
16 -
 17
17 -
 18
18 -
 19
19 -
 20
20 -
 21
21 -
 22
22 -
 23
23 -
 24
24 -
 25
25 -
 26
26 -
 27
27 -
 28
28 -
 29
29 -
30
-
31
-
32
-
33
-
34
-
35
-
36
-
37
-
38
-
39
-
40
-
41
-
42
-
43
-
44
 |
 |

M A N AG E M E N T ’ S D I S C U S S I O N A N D A N A LYS I S
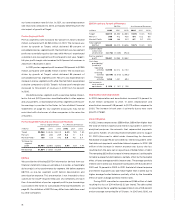
Analysis of Operations
Earnings
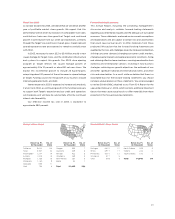
Our net earnings were $1,654 million
in 2002, compared with $1,368
million in 2001 and $1,264 million in
2000. Earnings per share were $1.81
in 2002, $1.50 in 2001 and $1.38 in
2000. References to earnings per
share refer to diluted earnings per
share. Earnings per share, dividends
per share and common shares
outstanding reflect our 2000 two-
for-one share split.
Earnings Analysis
(millions) 2002 2001 2000
Net earnings before unusual items $1,654 $1,410 $1,264
Unusual items, after tax –(42) –
Net earnings $1,654 $1,368 $1,264
Management uses net earnings before unusual items, among
other standards, to measure operating performance. It supplements,
and is not intended to represent a measure of performance in
accordance with, disclosures required by accounting principles
generally accepted in the United States (GAAP).
The $42 million after-tax ($.05 per share) unusual item in 2001
relates to the required adoption of a new accounting standard
applicable to securitized accounts receivable (discussed in detail
under Accounting for Accounts Receivable on page 19).
Management’s discussion and analysis is based on our
Consolidated Results of Operations as shown on page 24.
Revenues and
Comparable-store Sales
In 2002, total revenues increased
10.3 percent and comparable-store
sales increased 1.1 percent. In 2001,
total revenues increased 9.7 percent
and comparable-store sales in-
creased 2.7 percent over 2000, with
both years’ results on a similar 52-
week basis (since 2000 was a
53-week year, the first week is
removed for comparability). Total
revenues include retail sales and net
credit card revenues. Comparable-
store sales are sales from stores
open longer than one year. Revenue growth in 2002 and 2001
reflected Target’s new store expansion, our overall comparable-store
sales growth and growth in our credit card operations. The impact
of price deflation in 2001 and 2000 was minimal and, as a result,
the overall comparable-store sales increase closely approximated
real growth. In 2002, price deflation was somewhat more significant
than in the two prior years and had a negative impact of
approximately 3 percent on the comparable-store sales increase.
Revenues and Comparable-store Sales Growth
(52-week basis) 2002 2001 2000
Comparable- Comparable- Comparable-
store store store
Revenues Sales Revenues Sales Revenues Sales
Target 13.3% 2.2% 13.1% 4.1% 10.5% 3.4%
Mervyn’s (5.2) (5.3) (1.7) (1.5) 0.2 0.3
Marshall Field’s (3.1) (3.7) (5.2) (5.7) (3.6) (4.0)
Total 10.3% 1.1% 9.7% 2.7% 7.8% 2.4%
Revenues per Square Foot*
(52-week basis) 2002 2001 2000
Target $278 $274 $268
Mervyn’s 178 187 190
Marshall Field’s 180 186 205
*Thirteen-month average retail square feet.
Gross Margin Rate
Gross margin rate represents gross margin (sales less cost of sales)
as a percent of sales. In 2002, our consolidated gross margin rate
expanded by almost a full percentage point to a rate of 31.5 percent.
The growth is attributable to rate expansion at both Target and
Mervyn’s, partially offset by the mix impact of growth at Target, our
lowest gross margin rate division.
In 2001, our gross margin rate was essentially even with 2000,
benefiting from improvement at both Target and Mervyn’s, offset
by unfavorable performance at Marshall Field’s and the mix impact
of growth at Target.
Operating Expense Rate
Operating expense rate represents selling, general and administrative
expense (including buying and occupancy, advertising, start-up and
other expense) as a percent of sales. Operating expense excludes
depreciation and amortization and expenses associated with our
credit card operations, which are separately reflected on our
Consolidated Results of Operations. In 2002, our operating expense
rate rose modestly compared to 2001 because certain items such
as medical expenses increased at a faster pace than sales and this
effect was only partially offset by the mix impact of growth at Target,
17
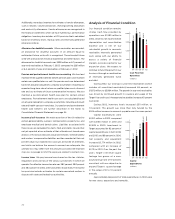
$1.23
Diluted Earnings
per Share
’98 ’99 ’00 ’01 ’02
$.99
$1.38
$1.50
$1.81
1.75
1.50
1.25
1.00
.75
.50
.25
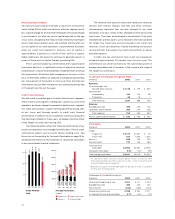
$30,635
Total Revenues
(millions)
’98 ’99 ’00 ’01 ’02
$33,657
$36,851
$39,826
$43,917
45,000
37,500
30,000
22,500
15,000
7,500