Target 2002 Annual Report Download - page 21
Download and view the complete annual report
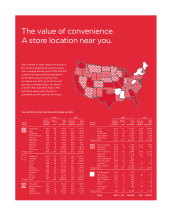
Please find page 21 of the 2002 Target annual report below. You can navigate through the pages in the report by either clicking on the pages listed below, or by using the keyword search tool below to find specific information within the annual report.-
 1
1 -
2
-
3
-
4
-
5
-
6
-
7
-
8
-
9
-
10
-
 11
11 -
 12
12 -
 13
13 -
 14
14 -
 15
15 -
 16
16 -
 17
17 -
 18
18 -
 19
19 -
 20
20 -
 21
21 -
 22
22 -
 23
23 -
 24
24 -
 25
25 -
 26
26 -
 27
27 -
 28
28 -
 29
29 -
 30
30 -
 31
31 -
32
-
33
-
34
-
35
-
36
-
37
-
38
-
39
-
40
-
41
-
42
-
43
-
44
 |
 |

called or repurchased $144 million and $35 million of debt,
respectively, which resulted in losses of $9 million ($.01 per share)
and $5 million (less than $.01 per share), respectively. Also in 2000,
$371 million of puttable debt was put to us, resulting in a gain of
$4 million (less than $.01 per share).
In April 2002, the Financial Accounting Standards Board issued
Statement of Financial Accounting Standards (SFAS) No. 145,
“Rescission of FASB Statements No. 4, 44 and 64, Amendment of
FASB Statement No. 13, and Technical Corrections.” We elected to
early adopt this Statement in the first quarter of 2002. Previously,
all gains and losses from the early extinguishment of debt were
required to be aggregated and classified as an extraordinary item
in the Consolidated Results of Operations, net of the related tax
effect. Under SFAS No. 145, gains and losses from the early
extinguishment of debt are included in interest expense. Prior year
extraordinary items have been reclassified to reflect this change.
The adoption of SFAS No. 145 had no impact on current year or
previously reported net earnings, cash flows or financial position.
Accounting for Accounts Receivable
On August 22, 2001, Target Receivables Corporation (TRC) sold,
through the Target Credit Card Master Trust (the Trust), $750 million
of receivable-backed securities to the public. Prior to this transaction,
the accounting guidance applicable to our receivable-backed
securities transactions was SFAS No. 125, “Accounting for Transfers
and Servicing of Financial Assets and Extinguishments of Liabilities,”
resulting in sale accounting treatment. Concurrent with this
transaction, SFAS No. 140 (which replaced SFAS No. 125 in its
entirety) became the applicable accounting guidance. Application
of SFAS No. 140 resulted in secured financing accounting for all
outstanding transactions. This new accounting treatment results
from the fact that the Trust is not a qualifying special purpose entity
under SFAS No. 140.
Beginning on August 22, 2001, our consolidated financial
statements reflected the consolidation of these outstanding
obligations. We reflected the obligation to holders of the $800
million (face value) of previously sold receivable-backed securities
(Series 1997-1 and 1998-1, Class A Certificates) as debt of TRC, and
we recorded the receivables at fair value in place of the previously
recorded retained interests related to the sold securities. This resulted
in an unusual pre-tax charge of $67 million ($.05 per share) in 2001.
Our Consolidated Results of Operations did not include finance
charge revenues or loss provision related to the publicly held
receivable-backed securities until August 22, 2001. Payments
accrued to holders of our publicly held receivable-backed securities
prior to August 22, 2001 are included in our Pre-tax Earnings
Reconciliation on page 35 as interest equivalent. Interest equivalent
was $27 million in 2001 and $50 million in 2000.
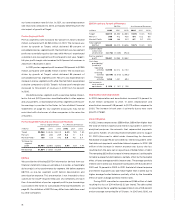
Fourth Quarter Results
Due to the seasonal nature of our business, fourth quarter operating
results typically represent a substantially larger share of total
year revenues and earnings due to the inclusion of the holiday
shopping season.
Fourth quarter 2002 net earnings were $688 million, compared
with $658 million in 2001. Earnings per share were $.75 for the
quarter, compared with $.72 in 2001. Total revenues increased 6.4
percent and 13-week comparable-store sales decreased 2.2 percent.
Our pre-tax segment profit increased 1.4 percent to $1,291 million,
driven by growth at Target, partially offset by declines at Mervyn’s
and Marshall Field’s.
Fourth Quarter Pre-tax Segment Profit and
Percent Change from Prior Year
(millions) 2002 2001 2000
Target $1,165 8.0% $1,078 20.9% $ 892 10.0%
Mervyn’s 75 (42.9) 131 20.8 108 57.7
Marshall Field’s 51 (18.9) 63 (20.2) 79 (34.4)
Total $1,291 1.4% $1,272 17.9% $1,079 7.9%
Net earnings $ 688 4.4% $ 658 19.3% $ 552 11.8%
Critical Accounting Estimates
Our analysis of operations and financial condition are based upon
our consolidated financial statements, which have been prepared
in accordance with GAAP. The preparation of these financial
statements requires us to make estimates and assumptions that
affect the reported amounts of assets and liabilities at the date of
the financial statements, the reported amounts of revenues and
expenses during the reporting period, and the related disclosures
of contingent assets and liabilities. In the Notes to Consolidated
Financial Statements, we describe our significant accounting policies
used in the preparation of the consolidated financial statements.
We evaluate our estimates on an ongoing basis. We base our
estimates on historical experience and on various other assumptions
that we believe to be reasonable under the circumstances. Actual
results could differ from these estimates under different assumptions
or conditions.
The following items in our consolidated financial statements
require significant estimation or judgment:
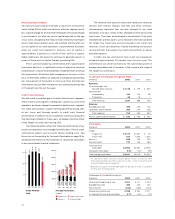
Inventory and cost of sales We account for inventory and the
related cost of sales under the retail inventory method using the
LIFO basis. Under the retail inventory method, inventory is stated
at cost, which is determined by applying a cost-to-retail ratio to
each similar merchandise grouping’s ending retail value. Since this
inventory value is adjusted regularly to reflect market conditions,
our inventory methodology reflects the lower of cost or market. We
also reduce inventory for estimated losses related to shortage, based
upon historical losses verified by prior physical inventory counts.
19