Target 2002 Annual Report Download - page 22
Download and view the complete annual report
Please find page 22 of the 2002 Target annual report below. You can navigate through the pages in the report by either clicking on the pages listed below, or by using the keyword search tool below to find specific information within the annual report.-
 1
1 -
2
-
3
-
4
-
5
-
6
-
7
-
8
-
9
-
10
-
11
-
 12
12 -
 13
13 -
 14
14 -
 15
15 -
 16
16 -
 17
17 -
 18
18 -
 19
19 -
 20
20 -
 21
21 -
 22
22 -
 23
23 -
 24
24 -
 25
25 -
 26
26 -
 27
27 -
 28
28 -
 29
29 -
 30
30 -
 31
31 -
 32
32 -
33
-
34
-
35
-
36
-
37
-
38
-
39
-
40
-
41
-
42
-
43
-
44
 |
 |
Additionally, we reduce inventory for estimates of vendor allowances,
such as rebates, volume allowances, shelving/slotting allowances
and exclusivity allowances. Vendor allowances are recognized in
the financial statements when we have fulfilled our performance
obligations. Inventory also includes a LIFO provision that is calculated
based on inventory levels, markup rates and internally generated
retail price indices.
Allowance for doubtful accounts When receivables are recorded,
an allowance for doubtful accounts in an amount equal to
anticipated future write-offs is recognized. The estimated future
write-offs are based on historical experience and other factors. The
allowance for doubtful accounts was $399 million or 6.7 percent of
year-end receivables at February 1, 2003, compared to $261 million
or 6.4 percent of year-end receivables at February 2, 2002.
Pension and postretirement health care accounting We fund and
maintain three qualified defined benefit pension plans and maintain
certain non-qualified plans as well. Our pension costs are determined
based on actuarial calculations using key assumptions including our
expected long-term rate of return on qualified plan assets, discount
rate and our estimate of future compensation increases. We also
maintain a postretirement health care plan for certain retired
employees. Postretirement health care costs are calculated based
on actuarial calculations using key assumptions including a discount
rate and health care cost trend rates. Our pension and postretirement
health care benefits are further described in the Notes to
Consolidated Financial Statements on page 34.
Insurance/self-insurance We retain a portion of the risk related to
certain general liability, workers’ compensation, property loss and
employee medical and dental claims. Liabilities associated with
these losses are calculated for claims filed, and claims incurred but
not yet reported, at our estimate of their ultimate cost, based upon
analysis of historical data and actuarial estimates. General liability
and workers’ compensation liabilities are then recorded at their net
present value. Our expected loss accruals are based on estimates,
and while we believe the amounts accrued are adequate, the
ultimate loss may differ from the amounts provided. We maintain
stop-loss coverage to limit the exposure related to certain risks.
Income taxes We pay income taxes based on the tax statutes,
regulations and case law of the various jurisdictions in which we
operate. Our effective income tax rate was 38.2 percent, 38.0 percent
and 38.4 percent in 2002, 2001 and 2000, respectively. The income
tax provision includes estimates for certain unresolved matters in
dispute with state and federal tax authorities.
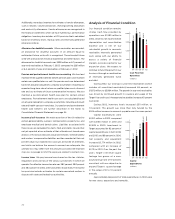
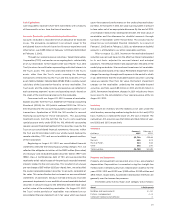
Analysis of Financial Condition
Our financial condition remains
strong. Cash flow provided by
operations was $1,590 million in
2002, driven by net income before
depreciation and amortization
expense and is net of our
substantial growth in accounts
receivable. Internally generated
cash, along with our ability to
access a variety of financial
markets, provides capital for our
expansion plans. We expect to
continue to fund the growth in our
business through a combination
of internally generated funds
and debt.
During 2002, our total gross year-end receivables (which
includes all securitized receivables) increased 46 percent, or
$1,872 million, to $5,964 million. The growth in year-end receivables
was driven by continued growth in issuance and usage of the
Target Visa credit card. Average total receivables increased 61 percent
from 2001.
During 2002, inventory levels increased $311 million, or
7.0 percent. This growth was more than fully funded by the
$524 million increase in accounts payable over the same period.
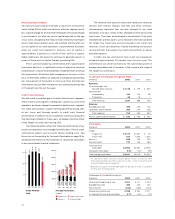
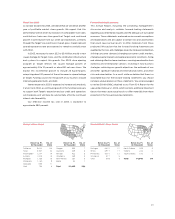
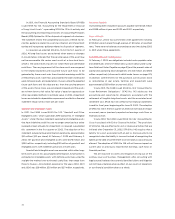
Capital expenditures were
$3,221 million in 2002, compared
with $3,163 million in 2001 and
$2,528 in 2000. Investment in
Target accounted for 92 percent of
capital expenditures in both 2002
and 2001, and 89 percent in 2000.
Net property and equipment
increased $1,774 million in 2002,
compared with an increase of
$2,115 in 2001. Over the past five
years, Target’s net retail square
footage has grown at a com-
pound annual rate of 10 percent,
consistent with our objective to
expand Target’s square footage
in the range of 8 to 10 percent
annually.
Approximately 66 percent of total expenditures in 2002 were
for new stores, expansions and remodels.
20
$1,918
Capital
Expenditures
(millions)
’98 ’99 ’00 ’01 ’02
$1,657
$2,528
$3,163
$3,221
3,200
2,400
1,600
800
$2,403
Cash Flow from
Operations
(millions)
’98 ’99 ’00 ’01 ’02
$1,891
$2,134
$2,012
$1,590
2,400
1,800
1,200
600