Target 2002 Annual Report Download - page 35
Download and view the complete annual report
Please find page 35 of the 2002 Target annual report below. You can navigate through the pages in the report by either clicking on the pages listed below, or by using the keyword search tool below to find specific information within the annual report.-
 1
1 -
2
-
3
-
4
-
5
-
6
-
7
-
8
-
9
-
10
-
11
-
12
-
13
-
14
-
15
-
16
-
17
-
18
-
19
-
20
-
21
-
22
-
23
-
24
-
 25
25 -
 26
26 -
 27
27 -
 28
28 -
 29
29 -
 30
30 -
 31
31 -
 32
32 -
 33
33 -
 34
34 -
 35
35 -
 36
36 -
 37
37 -
 38
38 -
 39
39 -
 40
40 -
 41
41 -
 42
42 -
 43
43 -
 44
44
 |
 |

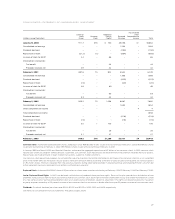
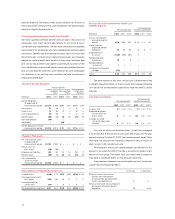
Options and Performance Shares Outstanding
Options
Total Outstanding
_
__
Currently Exercisable Performance
Shares
Number of Average Number of Average Potentially
(options and shares in thousands) Options Price
*
Options Price
*
Issuable
January 29, 2000 32,061 $15.32 15,717 $10.23 –
Granted 5,617 33.67
Canceled (481) 25.34
Exercised (4,939) 9.14
February 3, 2001 32,258 $19.30 18,662 $12.36 –
Granted 4,805 40.52
Canceled (437) 30.41
Exercised (5,311) 9.42
February 2, 2002 31,315 $24.07 17,629 $17.04 –
Granted 6,096 30.60 552
Canceled (561) 35.55
Exercised (2,063) 12.22
February 1, 2003 34,787 $25.73 21,931 $20.89 552
*Weighted average exercise price.
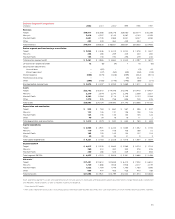
Options Outstanding
Options Outstanding Currently Exercisable
Range of
Exercise Number Average Average Number Average
(options in thousands) Prices Outstanding Life
*
Price
**
Exercisable Price
**
$ 5.53–$ 9.99 7,075 3.0 $ 7.66 7,075 $ 7.66
$10.00–$19.99 5,024 4.6 18.23 5,024 18.23
$20.00–$29.99 3,785 5.4 25.93 3,615 25.84
$30.00–$39.99 14,520 8.3 32.54 5,045 33.93
$40.00–$44.83 4,383 8.9 40.83 1,172 40.80
Total $ 5.53–$44.83 34,787 6.5 $25.73 21,931 $20.89
*Weighted average contractual life remaining in years.
** Weighted average exercise price.
In December 2002, the FASB issued SFAS No. 148, “Accounting
for Stock-Based Compensation — Transition and Disclosure.” SFAS
No. 148 amends SFAS No. 123, “Accounting for Stock-Based
Compensation,” to provide alternative methods of transition for a
voluntary change to the fair value based method of accounting for
stock-based compensation. We will adopt the fair value method of
recording stock-based compensation in the first quarter of 2003.
In accordance with the prospective transition method prescribed
in SFAS No. 148, the fair value based method will be applied
prospectively to awards granted subsequent to February 1, 2003.
Awards granted prior to February 2, 2003 will continue to be
accounted for under the intrinsic value method, and the pro forma
impact of accounting for those awards at fair value will continue to
be disclosed until the last of those awards vest in January of 2007.
The adoption of this method is expected to increase compensation
expense by less than $.01 per share in 2003.
Historically, and through February 1, 2003, we applied the
intrinsic value method prescribed in APB No. 25, “Accounting for
Stock Issued to Employees,” to account for our stock option plans.
No compensation expense related to options was recognized
because the exercise price of our employee stock options equals
the market price of the underlying stock on the grant date. The
expense related to the intrinsic value of performance-based and
restricted stock awards issued is not significant. If we had elected
to recognize compensation cost based on the fair value of the
awards at the grant date, net earnings would have been the pro
forma amounts shown below.
Pro Forma Earnings
(millions, except per share data) 2002 2001 2000
Net earnings — as reported $1,654 $1,368 $1,264
Stock-based employee compensation
expense determined under fair value
based method, net of tax (31) (28) (17)
Net earnings — pro forma $1,623 $1,340 $1,247
Earnings per share:
Basic — as reported $1.82 $1.52 $1.40
Basic — pro forma $1.79 $1.49 $1.38
Diluted — as reported $1.81 $1.50 $1.38
Diluted — pro forma $1.78 $1.47 $1.37
The Black-Scholes model was used to estimate the fair value
of the options at grant date based on the following assumptions:
2002 2001 2000
Dividend yield .8
%
.6
%
.6%
Volatility 35
%
30
%
30%
Risk-free interest rate 3.0
%
4.3
%
4.8
%
Expected life in years 5.0 5.0 5.0
Weighted average fair value
at grant date $10.07 $13.09 $11.15
Defined Contribution Plans
Employees who meet certain eligibility requirements can participate
in a defined contribution 401(k) plan by investing up to 80 percent
of their compensation. We match 100 percent of each employee’s
contribution up to 5 percent of respective total compensation. Our
contribution to the plan is initially invested in Target Corporation
common stock. Benefits expense related to these matching
contributions was $111 million in 2002, $97 million in 2001 and
$92 million in 2000.
In addition, we maintain a non-qualified defined contribution
plan that allows participants who are otherwise limited by qualified
plan statutes or regulations to defer compensation and earn returns
tied to the results of our 401(k) plan investment choices. We manage
the risk of offering this retirement savings plan to this group of
employees through a variety of means, including investing in vehicles
that effectively hedge a substantial portion of our exposure to
these returns.
During the year, certain non-qualified pension and survivor
benefits owed to current executives were exchanged for deferrals
in this non-qualified plan. Additionally, certain retired executives
accepted our offer to exchange our obligation to them in a frozen
non-qualified plan for deferrals in this plan. These exchanges resulted
in pre-tax net expense of $33 million ($.02 per share). These
amounts reflect $47 million of additional non-qualified defined
contribution plan benefits expense partially offset by reduced net
33