Verizon Wireless 2007 Annual Report Download - page 26
Download and view the complete annual report
Please find page 26 of the 2007 Verizon Wireless annual report below. You can navigate through the pages in the report by either clicking on the pages listed below, or by using the keyword search tool below to find specific information within the annual report.-
 1
1 -
2
-
3
-
4
-
5
-
6
-
7
-
8
-
9
-
10
-
11
-
12
-
13
-
14
-
15
-
 16
16 -
 17
17 -
 18
18 -
 19
19 -
 20
20 -
 21
21 -
 22
22 -
 23
23 -
 24
24 -
 25
25 -
 26
26 -
 27
27 -
 28
28 -
 29
29 -
 30
30 -
 31
31 -
 32
32 -
 33
33 -
 34
34 -
 35
35 -
 36
36 -
37
-
38
-
39
-
40
-
41
-
42
-
43
-
44
-
45
-
46
-
47
-
48
-
49
-
50
-
51
-
52
-
53
-
54
-
55
-
56
-
57
-
58
-
59
-
60
-
61
-
62
-
63
-
64
-
65
-
66
-
67
-
68
-
69
-
70
-
71
-
72
-
73
-
74
-
75
-
76
 |
 |

24
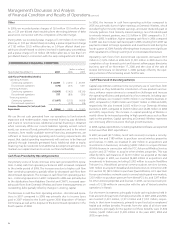
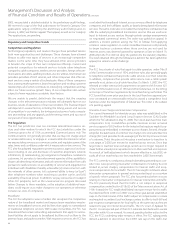
Operating Revenues
(dollars in millions)
Years Ended December 31, 2007 2006 2005
Verizon Telecom
Mass Markets $ 21,978 $ 22,234 $ 20,044
Wholesale 8,086 8,336 9,084
Other 1,862 2,368 2,566
Verizon Business
Enterprise Business 14,677 14,296 6,385
Wholesale 3,345 3,281 1,386
International and Other 3,214 3,101 –
Intrasegment Eliminations (2,846) (2,888) (1,849)
TotalWirelineOperatingRevenues $ 50,316 $ 50,728 $ 37,616
Verizon Telecom
Mass Markets
Verizon Telecom’s Mass Markets revenue includes local exchange (basic
service and end-user access), value-added services, long distance, broad-
band services for residential and certain small business accounts and FiOS
TV services. Also included are revenues generated from former MCI con-
sumer and small business products and services. Long distance includes
both regional toll services and long distance services. Broadband services
include DSL and FiOS data.
Our Mass Markets revenue decreased by $256 million, or 1.2% in 2007,
and increased by $2,190 million, or 10.9% in 2006. The decrease in 2007
was primarily driven by lower demand and usage of our basic local
exchange and accompanying services, attributable to consumer sub-
scriber losses. These losses are driven by competition and technology
substitution, including wireless and VoIP. These decreases were partially
offset by growth from broadband services and FiOS TV services and the
inclusion of the results of operations of the former MCI business subse-
quent to the close of the merger on January 6, 2006, which helped drive
the increase in 2006 over 2005.
Declines in switched access lines in service of 8.1% in 2007 and 7.6% in
2006 were mainly driven by the effects of competition and technology
substitution.Residentialretailaccesslinesdeclined9.5%in2007and8.8%
in 2006, as customers substituted wireless, VoIP, broadband and cable ser-
vices for traditional voice landline services. At the same time, business retail
access lines declined 4.0% in 2007 and 3.2% in 2006, primarily reflecting
competition and a shift to high-speed access lines. The resulting total
retail access line loss was 7.6% and 6.9% in 2007 and 2006, respectively.
Access line losses include the loss of lines served by the former MCI.
We added 1,253,000 new broadband connections, including 854,000
for FiOS data in 2007. We ended 2007 with 8,235,000 broadband lines
in service, including 1,541,000 for FiOS data, representing an increase of
17.9% compared to 6,982,000 lines in service at December 31, 2006. In
addition, we added approximately 736,000 FiOS TV customers in 2007
and ended the year with a total of 943,000, an increase of approximately
355% compared to 207,000 FiOS TV customers at December 31, 2006. As
of December 31, 2007, for FiOS data and FiOS TV, we achieved penetra-
tion rates of 20.6% and 16.0%, respectively, across the markets where we
have been selling these services.
Wholesale
Wholesale revenues are earned from long distance and other com-
peting carriers who use our local exchange facilities to provide services
to their customers. Switched access revenues are generated from fixed
and usage-based charges paid by carriers for access to our local network.
Special access revenues are generated from carriers that buy dedicated
local exchange capacity to support their private networks. Wholesale
services also include local wholesale revenues from unbundled network
elements (UNEs) and interconnection revenues from competitive local
exchange carriers (CLECs) and wireless carriers.
Wholesale revenues decreased by $250 million, or 3.0% in 2007 and by
$748 million, or 8.2% in 2006, due to declines in switched access rev-
enues and local wholesale revenues (UNEs) and, in 2006, the reduction
in access revenues billed to the former MCI mass market entities. These
declines were partially offset by increases in special access revenues.
Switched minutes of use (MOUs) declined in 2007 and 2006, reflecting
the impact of access line loss and wireless substitution. Wholesale lines
decreased by 15.9% in 2007 due to the ongoing impact of a 2005 deci-
sion by a major competitor to deemphasize their local market initiatives.
Special access revenue growth reflects continuing demand for high-
capacity, high-speed digital services, partially offset by lower demand for
older, low-speed data products and services. As of December 31, 2007,
customer demand for high-capacity and digital data services increased
8.2% compared to 2006.
The FCC regulates the rates that we charge customers for interstate access
services.See“OtherFactorsThatMayAffectFutureResults–Regulatory
andCompetitiveTrends–FCCRegulation”foradditionalinformationon
FCC rulemaking concerning federal access rates, universal service and
certain broadband services.
OtherRevenues
Other revenues include such services as operator services (including
deaf relay services), public (coin) telephone, card services and supply
sales, as well as dial around services including 10-10-987, 10-10-220,
1-800-COLLECT and Prepaid Cards.
Verizon Telecom’s revenues from other services decreased by $506
million, or 21.4% in 2007, and by $198 million, or 7.7% in 2006. These rev-
enue decreases were mainly due to the discontinuation of non-strategic
product lines and reduced business volumes, partially offset by the inclu-
sion of revenues from the former MCI in 2006.
Verizon Business
Enterprise Business
Our Enterprise Business channel distributes voice, data and Internet
communications services to medium and large business customers, multi-
national corporations, and state and federal government customers. In
addition to communication services, this channel provides value-added
services that make communications more secure, reliable and efficient.
Enterprise Business provides managed network services for customers
that outsource all or portions of their communications and information
processing operations and data services such as Private IP, Private Line,
FrameRelayandATMservices,bothdomesticallyandinternationally.
Enterprise Business 2007 revenues of $14,677 million increased by
$381 million, or 2.7%, as compared to 2006, primarily reflecting growth
in demand for our strategic products, specifically IP services and man-
aged services, as well as the inclusion of the results of operations of the
Management’s Discussion and Analysis
ofFinancialConditionandResultsofOperations continued