Verizon Wireless 2007 Annual Report Download - page 28
Download and view the complete annual report
Please find page 28 of the 2007 Verizon Wireless annual report below. You can navigate through the pages in the report by either clicking on the pages listed below, or by using the keyword search tool below to find specific information within the annual report.-
 1
1 -
2
-
3
-
4
-
5
-
6
-
7
-
8
-
9
-
10
-
11
-
12
-
13
-
14
-
15
-
16
-
17
-
 18
18 -
 19
19 -
 20
20 -
 21
21 -
 22
22 -
 23
23 -
 24
24 -
 25
25 -
 26
26 -
 27
27 -
 28
28 -
 29
29 -
 30
30 -
 31
31 -
 32
32 -
 33
33 -
 34
34 -
 35
35 -
 36
36 -
 37
37 -
 38
38 -
39
-
40
-
41
-
42
-
43
-
44
-
45
-
46
-
47
-
48
-
49
-
50
-
51
-
52
-
53
-
54
-
55
-
56
-
57
-
58
-
59
-
60
-
61
-
62
-
63
-
64
-
65
-
66
-
67
-
68
-
69
-
70
-
71
-
72
-
73
-
74
-
75
-
76
 |
 |

26
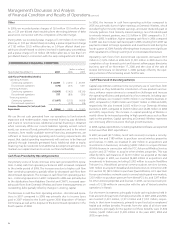
Segment income decreased by $119 million, or 7.3% in 2007 and by $281
million, or 14.7% in 2006, due to the after-tax impact of operating rev-
enues and operating expenses described above, along with the impact
of favorable income tax adjustments in 2005.
Non-recurring or non-operational items not included in Verizon Wireline’s
segment income totaled $714 million, $407 million and ($168) million
in 2007, 2006, and 2005, respectively. Non-recurring or non-operational
items in 2007 included costs associated with severance and other related
charges, costs incurred related to network, non-network software, and
other activities in connection with the spin-off of local exchange assets
inMaine, New HampshireandVermont(see“RecentDevelopments”
section), as well as costs associated with merger integration initiatives,
principally related to the acquisition of MCI and other items. Non-recurring
or non-operational items in 2006 included costs associated with sever-
ance activity, pension settlement losses, Verizon Center relocation-related
costs and merger integration costs. Merger integration costs primarily
included costs related to advertising and re-branding initiatives, facility
exit costs, severance costs, labor and contractor costs related to informa-
tion technology integration initiatives and employee retention expenses.
Non-recurring or non-operational items in 2005 related to the gain on
the sale of our Hawaii wireline operations, the net gain on the sale of a
New York City office building, changes to management retirement ben-
efit plans, severance costs and Verizon Center relocation-related costs.
Domestic Wireless
Our Domestic Wireless segment provides wireless voice and data services,
other value-added services and equipment sales across the United States.
This segment primarily represents the operations of the Verizon Wireless
joint venture with Vodafone. Verizon owns a 55% interest in the joint ven-
ture and Vodafone owns the remaining 45%. All financial results included
in the tables below reflect the consolidated results of Verizon Wireless.
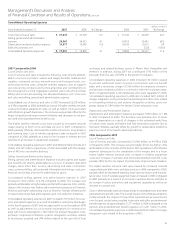
Operating Revenues
(dollars in millions)
Years Ended December 31, 2007 2006 2005
Service revenues $ 38,016 $ 32,796 $ 28,131
Equipment and other 5,866 5,247 4,170
Total Domestic
WirelessOperatingRevenue $ 43,882 $ 38,043 $ 32,301
Domestic Wireless’s total operating revenues of $43,882 million were
$5,839 million, or 15.3% higher in 2007 compared to 2006. Service rev-
enues of $38,016 million were $5,220 million, or 15.9% higher than 2006.
The service revenue increase was primarily due to an 11.3% increase in
customers as of December 31, 2007 compared to December 31, 2006, and
increased average revenue per customer. Equipment and other revenue
increased $619 million, or 11.8% in 2007 compared to 2006, principally as
a result of increases in the number of customers upgrading their wireless
devices. Other revenue also increased due to increases in cost recovery
surcharges and regulatory fees.
Total customers as of December 31, 2007 were 65.7 million, of which 97%
were retail customers, compared to 59.1 million, of which 96% were retail
customersatDecember31,2006.Retail(non-wholesale)customersare
customers who are directly served and managed by Verizon Wireless and
who buy its branded services. Our Domestic Wireless customer base as
of December 31, 2007 was 93% retail postpaid compared to 92.6% retail
postpaid at December 31, 2006. Total average monthly churn was 1.21%
in 2007 compared to 1.17% in 2006.
Our Domestic Wireless segment ended 2007 with 63.7 million retail
customers, an increase of 6.9 million net new retail customers or 12.2%,
compared to December 31, 2006. Average monthly retail postpaid churn,
the rate at which retail postpaid customers disconnect service, was 0.91%
in 2007, unchanged compared to 2006.
Average retail service revenue per customer per month increased 2.2% to
$51.57 in 2007 compared to 2006. Average retail data service revenue per
customer per month increased 43.9% in 2007 compared to 2006 driven
by increased use of our messaging service, VZAccess, and other data ser-
vices.Retaildatarevenueswere$7,309millionandaccountedfor19.7%
of retail service revenue in 2007, compared to $4,445 million and 14.0%
of retail service revenue in 2006.
Domestic Wireless’s total operating revenues of $38,043 million in 2006
increased $5,742 million, or 17.8% compared to 2005. Service revenues of
$32,796 million were $4,665 million, or 16.6% higher than 2005. The ser-
vice revenue increase was primarily due to a 15.0% increase in customers
as of December 31, 2006 compared to December 31, 2005, and increased
average revenue per customer. Equipment and other revenue increased
$1,077 million, or 25.8% in 2006 compared to 2005 principally as a result
of increases in the number and price of wireless devices sold. Other rev-
enue also increased due to increases in regulatory fees, primarily the
universal service fund and cost recovery surcharges.
Average retail service revenue per customer per month increased 0.7% to
$50.44 in 2006 compared to 2005. Average retail data service revenue per
customer per month increased 71.3% in 2006, compared to 2005, driven
by increased use of our messaging, VZAccess and other data services.
However, Domestic Wireless experienced an increase in the proportion
of customers on its Family Share price plans, which put downward pres-
sureonaverageservicerevenuepercustomerduring2006.Retaildata
revenues were $4,445 million and accounted for 14.0% of retail service
revenue in 2006, compared to $2,232 million and 8.2% of retail service
revenue in 2005.
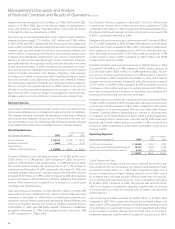
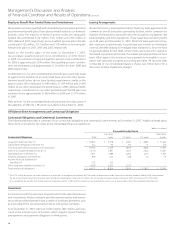
Operating Expenses
(dollars in millions)
Years Ended December 31, 2007 2006 2005
Cost of services and sales $ 13,456 $ 11,491 $ 9,393
Selling, general and administrative expense 13,477 12,039 10,768
Depreciation and amortization expense 5,154 4,913 4,760
$ 32,087 $ 28,443 $ 24,921
Cost of Services and Sales
Cost of services and sales, which are costs to operate the wireless net-
work as well as the cost of roaming, long distance and equipment sales,
increased by $1,965 million, or 17.1% in 2007 compared to 2006. Cost of
services increased due to higher wireless network costs in 2007 caused
by increased network usage, partially offset by lower rates for long dis-
tance, roaming and local interconnection. Cost of equipment sales grew
by 20.2% in 2007 compared to 2006. The increase was primarily attrib-
uted to an increase in equipment upgrades, together with an increase
in cost per unit as a result of increased sales of higher cost advanced
wireless devices.
Cost of services and sales increased by $2,098 million, or 22.3% in 2006
compared to 2005. This increase was primarily due to higher wireless net-
work costs in 2006 caused by increased network usage relating to both
voice and data services and an increase in cost of equipment sales driven
by an increase in wireless devices sold, resulting from an increase in
equipment upgrades, together with an increase in cost per unit in 2006.
Management’s Discussion and Analysis
ofFinancialConditionandResultsofOperations continued