Verizon Wireless 2007 Annual Report Download - page 70
Download and view the complete annual report
Please find page 70 of the 2007 Verizon Wireless annual report below. You can navigate through the pages in the report by either clicking on the pages listed below, or by using the keyword search tool below to find specific information within the annual report.-
 1
1 -
2
-
3
-
4
-
5
-
6
-
7
-
8
-
9
-
10
-
11
-
12
-
13
-
14
-
15
-
16
-
17
-
18
-
19
-
20
-
21
-
22
-
23
-
24
-
25
-
26
-
27
-
28
-
29
-
30
-
31
-
32
-
33
-
34
-
35
-
36
-
37
-
38
-
39
-
40
-
41
-
42
-
43
-
44
-
45
-
46
-
47
-
48
-
49
-
50
-
51
-
52
-
53
-
54
-
55
-
56
-
57
-
58
-
59
-
 60
60 -
 61
61 -
 62
62 -
 63
63 -
 64
64 -
 65
65 -
 66
66 -
 67
67 -
 68
68 -
 69
69 -
 70
70 -
 71
71 -
 72
72 -
 73
73 -
 74
74 -
 75
75 -
 76
76
 |
 |

68
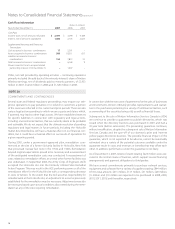
Notes to Consolidated Financial Statements continued
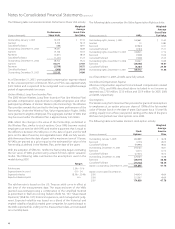
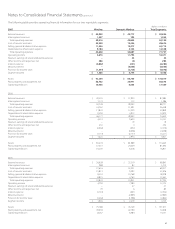
Reconciliation To Consolidated Financial Information
A reconciliation of the results for the operating segments to the applicable line items in the consolidated financial statements is as follows:
(dollars in millions)
2007 2006 2005
Operating Revenues
Total reportable segments $ 94,198 $ 88,771 $ 69,917
Impact of Hawaii (2005) and other operations sold (2006) –104 180
Corporate, eliminations and other (729) (693) (579)
Consolidated operating revenues – reported $ 93,469 $ 88,182 $ 69,518
Operating Expenses
Total reportable segments $ 77,727 $ 74,620 $ 57,745
Merger integration costs (see Note 8) 178 232 –
Access line spin-o related charges (see Note 2) 84 – –
Taxes on foreign distributions (see Note 6) 15 – –
Verizon Center relocation (see Note 3) –184 (18)
Severance, pension and benet charges, net (see Note 3) 772 425 157
Impact of Hawaii (2005) and other operations sold (2006) (see Note 2) –89 118
Sales of businesses net (see Note 2) –– (530)
Lease impairment and other items (see Note 3) –– 125
Verizon Foundation contribution (see Note 2) 100 – –
Corporate, eliminations and other (985) (741) (660)
Consolidated operating expenses – reported $ 77,891 $ 74,809 $ 56,937
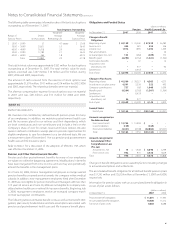
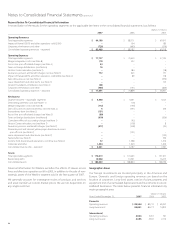
Net Income
Segment income – reportable segments $ 5,300 $ 4,601 $ 4,125
Debt extinguishment costs (see Note 11) –(16) –
Merger integration costs (see Note 8) (112) (146) –
Sales of businesses and investments, net (see Note 2) 5(541) 336
Extraordinary item (see Note 2) (131) – –
Access line spin-o related charges (see Note 2) (80) – –
Taxes on foreign distributions (see Note 6) (610) – (206)
Cumulative eect of accounting change (see Note 1) –(42) –
Verizon Center relocation, net (see Note 3) –(118) 8
Severance, pension and benet charges (see Note 3) (477) (258) (95)
Domestic print and Internet yellow pages directories business
spin-o costs (see Note 2) – (101) –
Lease impairment and other items (see Note 3) –– (133)
Tax benets (see Note 3) –– 336
Income from discontinued operations, net of tax (see Note 2) 72 1,398 1,370
Corporate and other 1,554 1,420 1,656
Consolidated net income – reported $ 5,521 $ 6,197 $ 7,397
Assets
Total reportable segments $ 176,019 $ 174,263 $ 151,917
Reconciling items 10,940 14,541 16,213
Consolidated assets $ 186,959 $ 188,804 $ 168,130
Financial information for Wireline excludes the effects of Hawaii access
lines and directory operations sold in 2005, in addition to the sale of non-
strategic assets of the Wireline segment sold in the first quarter of 2007.
We generally account for intersegment sales of products and services
and asset transfers at current market prices. We are not dependent on
any single customer.
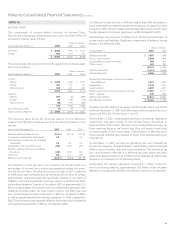
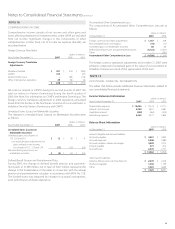
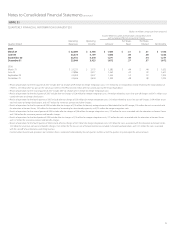
Geographic Areas
Our foreign investments are located principally in the Americas and
Europe. Domestic and foreign operating revenues are based on the
location of customers. Long-lived assets consist of plant, property and
equipment (net of accumulated depreciation) and investments in uncon-
solidated businesses. The table below presents financial information by
major geographic area:
(dollars in millions)
Years Ended December 31, 2007 2006 2005
Domestic
Operating revenues $ 89,504 $ 84,731 $ 69,327
Long-lived assets 85,081 82,277 74,813
International
Operating revenues 3,965 3,451 191
Long-lived assets 3,585 4,947 2,776