Verizon Wireless 2007 Annual Report Download - page 44
Download and view the complete annual report
Please find page 44 of the 2007 Verizon Wireless annual report below. You can navigate through the pages in the report by either clicking on the pages listed below, or by using the keyword search tool below to find specific information within the annual report.-
 1
1 -
2
-
3
-
4
-
5
-
6
-
7
-
8
-
9
-
10
-
11
-
12
-
13
-
14
-
15
-
16
-
17
-
18
-
19
-
20
-
21
-
22
-
23
-
24
-
25
-
26
-
27
-
28
-
29
-
30
-
31
-
32
-
33
-
 34
34 -
 35
35 -
 36
36 -
 37
37 -
 38
38 -
 39
39 -
 40
40 -
 41
41 -
 42
42 -
 43
43 -
 44
44 -
 45
45 -
 46
46 -
 47
47 -
 48
48 -
 49
49 -
 50
50 -
 51
51 -
 52
52 -
 53
53 -
 54
54 -
55
-
56
-
57
-
58
-
59
-
60
-
61
-
62
-
63
-
64
-
65
-
66
-
67
-
68
-
69
-
70
-
71
-
72
-
73
-
74
-
75
-
76
 |
 |

42
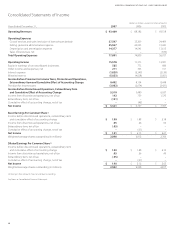
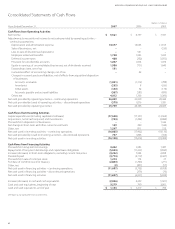
VERIZON COMMUNICATIONS INC. AND SUBSIDIARIES
Consolidated Statements of Cash Flows
(dollars in millions)
Years Ended December 31, 2007 2006 2005
Cash Flows from Operating Activities
Net Income $ 5,521 $ 6,197 $ 7,397
Adjustments to reconcile net income to net cash provided by operating activities –
continuing operations:
Depreciation and amortization expense 14,377 14,545 13,615
Sales of businesses, net –– (530)
Loss on sale of discontinued operations –541 –
Employee retirement benets 1,720 1,923 1,695
Deferred income taxes 408 (252) (1,093)
Provision for uncollectible accounts 1,047 1,034 1,076
Equity in earnings of unconsolidated businesses, net of dividends received 1,986 (731) 1,649
Extraordinary item, net of tax 131 – –
Cumulative eect of accounting change, net of tax –42 –
Changes in current assets and liabilities, net of eects from acquisition/disposition
of businesses:
Accounts receivable (1,931) (1,312) (788)
Inventories (255) 8 (236)
Other assets (140) 52 (176)
Accounts payable and accrued liabilities (567) (383) (899)
Other, net 4,012 1,366 (1,266)
Net cash provided by operating activities – continuing operations 26,309 23,030 20,444
Net cash provided by (used in) operating activities – discontinued operations (570) 1,076 1,581
Net cash provided by operating activities 25,739 24,106 22,025
Cash Flows from Investing Activities
Capital expenditures (including capitalized software) (17,538) (17,101) (14,964)
Acquisitions, net of cash acquired, and investments (763) (1,422) (4,684)
Proceeds from disposition of businesses –– 1,326
Net change in short-term and other current investments 169 290 (346)
Other, net 1,267 811 532
Net cash used in investing activities – continuing operations (16,865) (17,422) (18,136)
Net cash provided by (used in) investing activities – discontinued operations 757 1,806 (356)
Net cash used in investing activities (16,108) (15,616) (18,492)
Cash Flows from Financing Activities
Proceeds from long-term borrowings 3,402 3,983 1,487
Repayments of long-term borrowings and capital lease obligations (5,503) (11,233) (3,825)
Increase (decrease) in short-term obligations, excluding current maturities (3,252) 7,944 2,098
Dividends paid (4,773) (4,719) (4,427)
Proceeds from sale of common stock 1,274 174 37
Purchase of common stock for treasury (2,843) (1,700) (271)
Other, net (2) (201) (57)
Net cash used in nancing activities – continuing operations (11,697) (5,752) (4,958)
Net cash used in nancing activities – discontinued operations –(279) (76)
Net cash used in nancing activities (11,697) (6,031) (5,034)
Increase (decrease) in cash and cash equivalents (2,066) 2,459 (1,501)
Cash and cash equivalents, beginning of year 3,219 760 2,261
Cash and cash equivalents, end of year $ 1,153 $ 3,219 $ 760
See Notes to Consolidated Financial Statements.