Verizon Wireless 2007 Annual Report Download - page 62
Download and view the complete annual report
Please find page 62 of the 2007 Verizon Wireless annual report below. You can navigate through the pages in the report by either clicking on the pages listed below, or by using the keyword search tool below to find specific information within the annual report.-
 1
1 -
2
-
3
-
4
-
5
-
6
-
7
-
8
-
9
-
10
-
11
-
12
-
13
-
14
-
15
-
16
-
17
-
18
-
19
-
20
-
21
-
22
-
23
-
24
-
25
-
26
-
27
-
28
-
29
-
30
-
31
-
32
-
33
-
34
-
35
-
36
-
37
-
38
-
39
-
40
-
41
-
42
-
43
-
44
-
45
-
46
-
47
-
48
-
49
-
50
-
51
-
 52
52 -
 53
53 -
 54
54 -
 55
55 -
 56
56 -
 57
57 -
 58
58 -
 59
59 -
 60
60 -
 61
61 -
 62
62 -
 63
63 -
 64
64 -
 65
65 -
 66
66 -
 67
67 -
 68
68 -
 69
69 -
 70
70 -
 71
71 -
 72
72 -
73
-
74
-
75
-
76
 |
 |

60
Notes to Consolidated Financial Statements continued
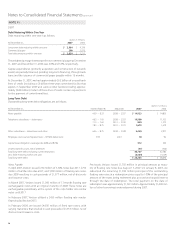
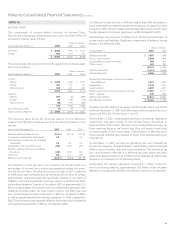
The following table summarizes the Value Appreciation Rights activity:
(shares in thousands) VARs
Weighted-
Average
Grant-Date
Fair Value
Outstanding rights, January 1, 2005 160,661 $ 15.63
Granted 10 14.85
Exercised (47,964) 12.27
Cancelled/Forfeited (3,784) 15.17
Outstanding rights, December 31, 2005 108,923 17.12
Exercised (7,448) 13.00
Cancelled/Forfeited (7,008) 23.25
Outstanding rights, December 31, 2006 94,467 16.99
Exercised (30,848) 15.07
Cancelled/Forfeited (3,207) 24.55
Outstanding rights, December 31, 2007 60,412 17.58
As of December 31, 2007, all VARs were fully vested.
Stock-Based Compensation Expense
After-tax compensation expense for stock-based compensation related
to RSUs, PSUs, and VARs described above included in net income as
reported was $750 million, $535 million and $359 million for 2007, 2006
and 2005, respectively.
Stock Options
The Verizon Long Term Incentive Plan provides for grants of stock options
to employees at an option price per share of 100% of the fair market
value of Verizon Stock on the date of grant. Each grant has a 10 year life,
vesting equally over a three year period, starting at the date of the grant.
We have not granted new stock options since 2004.
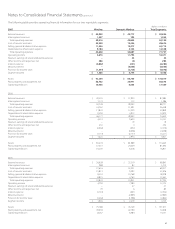
The following table summarizes Verizon’s stock option activity:
(shares in thousands)
Stock
Options
Weighted
Average
Exercise
Price
Outstanding, January 1, 2005 280,889 $ 46.18
Exercised (1,133) 28.73
Cancelled/Forfeited (19,996) 49.62
Outstanding, December 31, 2005 259,760 46.01
Exercised (3,371) 32.12
Cancelled/Forfeited (27,025) 43.72
Outstanding, December 31, 2006 229,364 46.48
Exercised (33,079) 38.50
Cancelled/Forfeited (21,422) 48.26
Options outstanding, December 31, 2007 174,863 47.78
Options exercisable, December 31,
2005 244,424 46.64
2006 225,067 46.69
2007 174,838 47.78
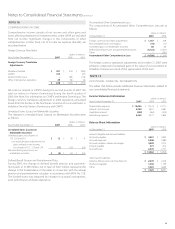
The following table summarizes Verizon’s Performance Share Unit activity:
(shares in thousands)
Performance
Share Units
Weighted-
Average
Grant-Date
Fair Value
Outstanding, January 1, 2005 10,079 $ 37.50
Granted 9,300 36.13
Cancelled/Forfeited (288) 36.91
Outstanding, December 31, 2005 19,091 36.84
Granted 14,166 32.05
Payments (3,607) 38.54
Cancelled/Forfeited (1,227) 37.25
Outstanding, December 31, 2006 28,423 34.22
Granted 10,371 37.59
Payments (5,759) 36.75
Cancelled/Forfeited (900) 36.18
Outstanding, December 31, 2007 32,135 34.80
As of December 31, 2007, unrecognized compensation expense related
to the unvested portion of Verizon’s RSUs and PSUs was approximately
$439 million and is expected to be recognized over a weighted-average
period of approximately two years.
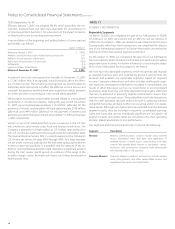
Verizon Wireless’s Long-Term Incentive Plan
The 2000 Verizon Wireless Long-Term Incentive Plan (the Wireless Plan)
provides compensation opportunities to eligible employees and other
participating affiliates of Verizon Wireless (the Partnership). The Wireless
Plan provides rewards that are tied to the long-term performance of the
Partnership. Under the Wireless Plan, Value Appreciation Rights (VARs)
were granted to eligible employees. The aggregate number of VARs that
may be issued under the Wireless Plan is approximately 343 million.
VARs reflect the change in the value of the Partnership, as defined in
the Wireless Plan, similar to stock options. Once VARs become vested,
employees can exercise their VARs and receive a payment that is equal to
the difference between the VAR price on the date of grant and the VAR
price on the date of exercise, less applicable taxes. VARs are fully exercis-
able three years from the date of grant with a maximum term of 10 years.
All VARs are granted at a price equal to the estimated fair value of the
Partnership, as defined in the Wireless Plan, at the date of the grant.
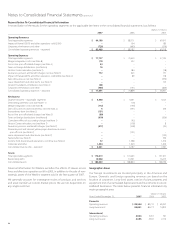
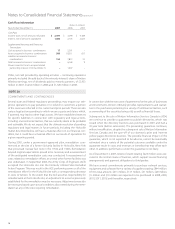
With the adoption of SFAS No. 123(R), the Partnership began estimating
the fair value of VARs granted using a Black-Scholes option valuation
model. The following table summarizes the assumptions used in the
model during 2007:
Ranges
Risk-free rate 3.2% – 5.1%
Expected term (in years) 0.9 – 3.4
Expected volatility 18.1% – 23.4%
Expected dividend yield n/a
The risk-free rate is based on the U.S. Treasury yield curve in effect at
the time of the measurement date. The expected term of the VARs
granted was estimated using a combination of the simplified method
as prescribed in Staff Accounting Bulletin (SAB) No. 107, “Share Based
Payments,” (SAB No. 107) historical experience, and management judg-
ment. Expected volatility was based on a blend of the historical and
implied volatility of publicly traded peer companies for a period equal to
the VARs expected life, ending on the measurement date, and calculated
on a monthly basis.