Verizon Wireless 2007 Annual Report Download - page 63
Download and view the complete annual report
Please find page 63 of the 2007 Verizon Wireless annual report below. You can navigate through the pages in the report by either clicking on the pages listed below, or by using the keyword search tool below to find specific information within the annual report.-
 1
1 -
2
-
3
-
4
-
5
-
6
-
7
-
8
-
9
-
10
-
11
-
12
-
13
-
14
-
15
-
16
-
17
-
18
-
19
-
20
-
21
-
22
-
23
-
24
-
25
-
26
-
27
-
28
-
29
-
30
-
31
-
32
-
33
-
34
-
35
-
36
-
37
-
38
-
39
-
40
-
41
-
42
-
43
-
44
-
45
-
46
-
47
-
48
-
49
-
50
-
51
-
52
-
 53
53 -
 54
54 -
 55
55 -
 56
56 -
 57
57 -
 58
58 -
 59
59 -
 60
60 -
 61
61 -
 62
62 -
 63
63 -
 64
64 -
 65
65 -
 66
66 -
 67
67 -
 68
68 -
 69
69 -
 70
70 -
 71
71 -
 72
72 -
 73
73 -
74
-
75
-
76
 |
 |

Notes to Consolidated Financial Statements continued
61
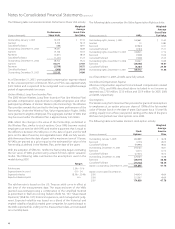
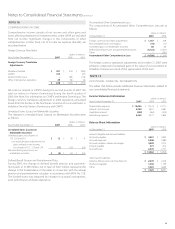
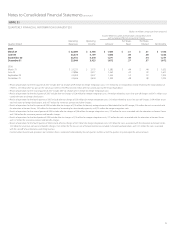
The following table summarizes information about Verizon’s stock options
outstanding as of December 31, 2007:
Stock Options Outstanding
Range of
Exercise Prices
Shares
(in thousands)
Weighted-
Average
Remaining Life
Weighted-
Average
Exercise Price
$ 20.00 – 29.99 27 4.7 years $ 27.68
30.00 – 39.99 20,671 5.5 36.45
40.00 – 49.99 76,518 2.9 44.06
50.00 – 59.99 77,183 2.1 54.43
60.00 – 69.99 464 1.8 60.74
Total 174,863 2.9 47.78
The total intrinsic value was approximately $223 million for stock options
outstanding as of December 31, 2007. The total intrinsic value for stock
options exercised was $147 million, $10 million and $6 million, during
2007, 2006 and 2005, respectively.
The amount of cash received from the exercise of stock options was
approximately $1,274 million, $101 million and $34 million for 2007, 2006
and 2005, respectively. The related tax benefits were not material.
The after-tax compensation expense for stock options was not material
in 2007, and was $28 million and $53 million for 2006 and 2005,
respectively.
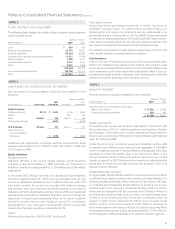
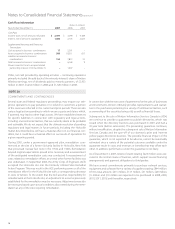
NOTE 15
EMPLOYEE BENEFITS
We maintain non-contributory defined benefit pension plans for many
of our employees. In addition, we maintain postretirement health care
and life insurance plans for our retirees and their dependents, which
are both contributory and non-contributory and include a limit on the
Company’s share of cost for certain recent and future retirees. We also
sponsor defined contribution savings plans to provide opportunities for
eligible employees to save for retirement on a tax-deferred basis. We use
a measurement date of December 31 for our pension and postretirement
health care and life insurance plans.
Refer to Note 1 for a discussion of the adoption of SFAS No. 158, which
was effective December 31, 2006.
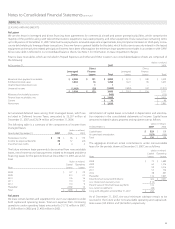
Pension and Other Postretirement Benefits
Pension and other postretirement benefits for many of our employees
are subject to collective bargaining agreements. Modifications in benefits
have been bargained from time to time, and we may also periodically
amend the benefits in the management plans.
As of June 30, 2006, Verizon management employees no longer earned
pension benefits or earned service towards the company retiree medical
subsidy. In addition, new management employees hired after December
31, 2005 are not eligible for pension benefits and managers with less than
13.5 years of service as of June 30, 2006 are not eligible for company-sub-
sidized retiree healthcare or retiree life insurance benefits. Beginning July
1, 2006, management employees receive an increased company match
on their savings plan contributions.
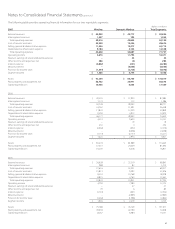
The following tables summarize benefit costs, as well as the benefit obli-
gations, plan assets, funded status and rate assumptions associated with
pension and postretirement health care and life insurance benefit plans:
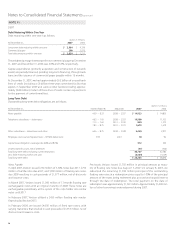
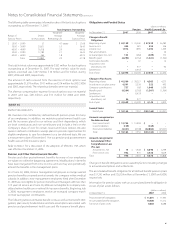
Obligations and Funded Status
(dollars in millions)
Pension Health Care and Life
At December 31, 2007 2006 2007 2006
Change in Benet
Obligations
Beginning of year $ 34,159 $ 35,540 $ 27,330 $ 26,783
Service cost 442 581 354 356
Interest cost 1,975 1,995 1,592 1,499
Plan amendments –––50
Actuarial (gain) loss, net 123 (282) (409) 152
Benets paid (4,204) (2,762) (1,561) (1,564)
Termination benets –47 –14
Acquisitions and
divestitures, net –477 –40
Settlements –(1,437) ––
End of year $ 32,495 $ 34,159 $ 27,306 $ 27,330
Change in Plan Assets
Beginning of year $ 41,509 $ 39,227 $ 4,303 $ 4,275
Actual return on plan assets 4,591 5,536 352 493
Company contributions 737 568 1,048 1,099
Benets paid (4,204) (2,762) (1,561) (1,564)
Settlements –(1,437) ––
Acquisitions and
divestitures, net 26 377 ––
End of year $ 42,659 $ 41,509 $ 4,142 $ 4,303
Funded Status
End of year $ 10,164 $ 7,350 $ (23,164) $ (23,027)
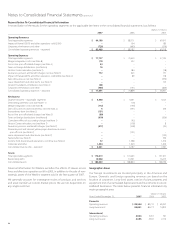
Amounts recognized on
the balance sheet
Noncurrent assets $ 13,745 $ 12,058 $ – $ –
Current liabilities (130) –(360) –
Noncurrent liabilities (3,451) (4,708) (22,804) (23,027)
Total $ 10,164 $ 7,350 $ (23,164) $ (23,027)
Amounts recognized in
Accumulated Other
Comprehensive Loss
(Pre-tax)
Actuarial loss, net $ 13 $ 1,428 $ 6,040 $ 6,799
Prior service cost 932 975 3,636 4,029
Total $ 945 $ 2,403 $ 9,676 $ 10,828
Changes in benefit obligations were caused by factors including changes
in actuarial assumptions and settlements.
The accumulated benefit obligation for all defined benefit pension plans
was $31,343 million and $32,724 million at December 31, 2007 and 2006,
respectively.
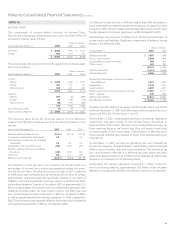
Information for pension plans with an accumulated benefit obligation in
excess of plan assets follows:
(dollars in millions)
At December 31, 2007 2006
Projected benet obligation $ 11,001 $ 11,495
Accumulated benet obligation 10,606 11,072
Fair value of plan assets 8,868 8,288