Verizon Wireless 2007 Annual Report Download - page 65
Download and view the complete annual report
Please find page 65 of the 2007 Verizon Wireless annual report below. You can navigate through the pages in the report by either clicking on the pages listed below, or by using the keyword search tool below to find specific information within the annual report.-
 1
1 -
2
-
3
-
4
-
5
-
6
-
7
-
8
-
9
-
10
-
11
-
12
-
13
-
14
-
15
-
16
-
17
-
18
-
19
-
20
-
21
-
22
-
23
-
24
-
25
-
26
-
27
-
28
-
29
-
30
-
31
-
32
-
33
-
34
-
35
-
36
-
37
-
38
-
39
-
40
-
41
-
42
-
43
-
44
-
45
-
46
-
47
-
48
-
49
-
50
-
51
-
52
-
53
-
54
-
 55
55 -
 56
56 -
 57
57 -
 58
58 -
 59
59 -
 60
60 -
 61
61 -
 62
62 -
 63
63 -
 64
64 -
 65
65 -
 66
66 -
 67
67 -
 68
68 -
 69
69 -
 70
70 -
 71
71 -
 72
72 -
 73
73 -
 74
74 -
 75
75 -
76
 |
 |

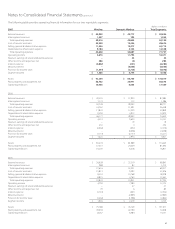
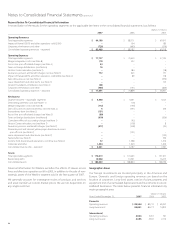
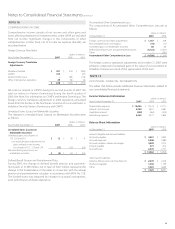
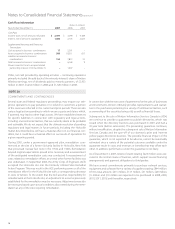
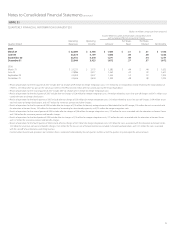
Notes to Consolidated Financial Statements continued
63
Additional Information
As a result of the adoption of SFAS No. 158 in 2006, we no longer record an
additional minimum pension liability. In prior years, as a result of changes
in interest rates and changes in investment returns, an adjustment to the
additional minimum pension liability was required for a number of plans,
as indicated below. The adjustment in the liability was recorded as a charge
or (credit) to Accumulated Other Comprehensive Loss, net of tax, in shar-
eowners’ investment in the consolidated balance sheets. The Additional
Minimum Pension Liability at December 31, 2006, was reduced by $809
million, ($526 million after-tax) based on the final measurement just prior
to the adoption of SFAS No. 158. The remaining $396 million, ($262 million
after-tax), was reversed as a result of the adoption of SFAS No. 158.
(dollars in millions)
Years Ended December 31, 2007 2006 2005
Increase (decrease) in minimum liability included in other comprehensive income, net of tax $ – $ (526) $ (51)
Assumptions
The weighted-average assumptions used in determining benefit obliga-
tions follow:
Pension Health Care and Life
At December 31, 2007 2006 2007 2006
Discount rate 6.50% 6.00% 6.50% 6.00%
Rate of future increases in compensation 4.00 4.00 4.00 4.00
The weighted-average assumptions used in determining net periodic
cost follow:
Pension Health Care and Life
Years Ended December 31, 2007 2006 2005 2007 2006 2005
Discount rate 6.00% 5.75% 5.75% 6.00% 5.75% 5.75%
Expected return on plan assets 8.50 8.50 8.50 8.25 8.25 7.75
Rate of compensation increase 4.00 4.00 5.00 4.00 4.00 4.00
In order to project the long-term target investment return for the total
portfolio, estimates are prepared for the total return of each major asset
class over the subsequent 10-year period, or longer. Those estimates
are based on a combination of factors including the following: current
market interest rates and valuation levels, consensus earnings expecta-
tions, historical long-term risk premiums and value-added. To determine
the aggregate return for the pension trust, the projected return of each
individual asset class is then weighted according to the allocation to that
investment area in the trust’s long-term asset allocation policy.
The assumed Health Care Cost Trend Rates follow:
Health Care and Life
At December 31, 2007 2006 2005
Health care cost trend rate assumed
for next year 10.00% 10.00% 10.00%
Rate to which cost trend rate
gradually declines 5.00 5.00 5.00
Year the rate reaches level it is assumed
to remain thereafter 2013 2011 2010
A one-percentage-point change in the assumed health care cost trend
rate would have the following effects:
(dollars in millions)
One-Percentage-Point Increase Decrease
Eect on 2007 service and interest cost $ 295 $ (234)
Eect on postretirement benet obligation as of
December 31, 2007 3,038 (2,512)