Verizon Wireless 2007 Annual Report Download - page 66
Download and view the complete annual report
Please find page 66 of the 2007 Verizon Wireless annual report below. You can navigate through the pages in the report by either clicking on the pages listed below, or by using the keyword search tool below to find specific information within the annual report.-
 1
1 -
2
-
3
-
4
-
5
-
6
-
7
-
8
-
9
-
10
-
11
-
12
-
13
-
14
-
15
-
16
-
17
-
18
-
19
-
20
-
21
-
22
-
23
-
24
-
25
-
26
-
27
-
28
-
29
-
30
-
31
-
32
-
33
-
34
-
35
-
36
-
37
-
38
-
39
-
40
-
41
-
42
-
43
-
44
-
45
-
46
-
47
-
48
-
49
-
50
-
51
-
52
-
53
-
54
-
55
-
 56
56 -
 57
57 -
 58
58 -
 59
59 -
 60
60 -
 61
61 -
 62
62 -
 63
63 -
 64
64 -
 65
65 -
 66
66 -
 67
67 -
 68
68 -
 69
69 -
 70
70 -
 71
71 -
 72
72 -
 73
73 -
 74
74 -
 75
75 -
 76
76
 |
 |

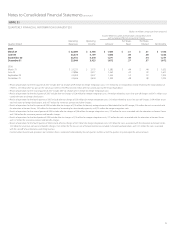
64
Notes to Consolidated Financial Statements continued
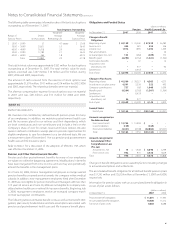
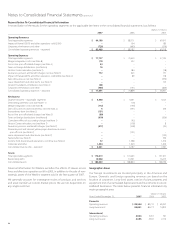
Plan Assets
Pension Plans
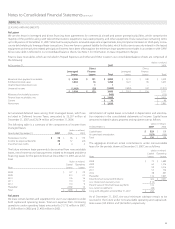
The weighted-average asset allocations for the pension plans by asset
category follow:
At December 31, 2007 2006
Asset Category
Equity securities 59% 63%
Debt securities 18 16
Real estate 64
Other 17 17
Total 100% 100%
Equity securities include Verizon common stock of $127 million and $95
million at December 31, 2007 and 2006, respectively. Other assets include
cash and cash equivalents (primarily held for the payment of benefits),
private equity and investments in absolute return strategies.
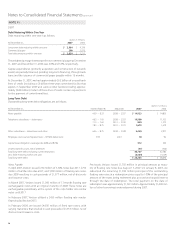
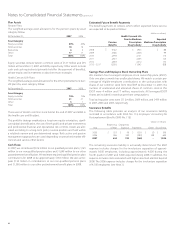
Health Care and Life Plans
The weighted-average asset allocations for the other postretirement ben-
efit plans by asset category follow:
At December 31, 2007 2006
Asset Category
Equity securities 74% 72%
Debt securities 21 21
Other 57
Total 100% 100%
There was no Verizon common stock held at the end of 2007 and 2006 in
the health care and life plans.
This portfolio strategy emphasizes a long-term equity orientation, signifi-
cant global diversification, the use of both public and private investments
and professional financial and operational risk controls. Assets are allo-
cated according to a long-term policy neutral position and held within
a relatively narrow and pre-determined range. Both active and passive
management approaches are used depending on perceived market effi-
ciencies and various other factors.
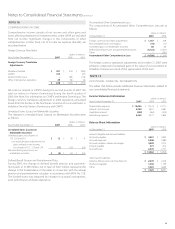
Cash Flows
In 2007, we contributed $612 million to our qualified pension plans, $125
million to our nonqualified pension plans and $1,048 million to our other
postretirement benefit plans. We estimate required qualified pension plan
contributions for 2008 to be approximately $350 million. We also antici-
pate $130 million in contributions to our non-qualified pension plans
and $1,580 million to our other postretirement benefit plans in 2008.
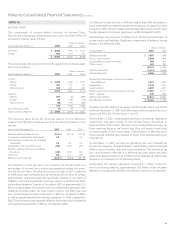
Estimated Future Benefit Payments
The benefit payments to retirees, which reflect expected future service,
are expected to be paid as follows:
(dollars in millions)
Pension
Benets
Health Care and Life
Prior to Medicare
Prescription
Drug Subsidy
Expected
Medicare Prescription
Drug Subsidy
2008 $4,422 $ 1,925 $ 88
2009 3,665 2,036 99
2010 2,944 2,131 110
2011 2,921 2,205 120
2012 2,864 2,212 133
2013 – 2017 13,926 11,045 838
Savings Plan and Employee Stock Ownership Plans
We maintain four leveraged employee stock ownership plans (ESOP).
Only one plan currently has unallocated shares. We match a certain per-
centage of eligible employee contributions to the savings plans with
shares of our common stock from this ESOP. At December 31, 2007, the
number of unallocated and allocated shares of common stock in this
ESOP were 4 million and 77 million, respectively. All leveraged ESOP
shares are included in earnings per share computations.
Total savings plan costs were $712 million, $669 million, and $499 million
in 2007, 2006 and 2005, respectively.
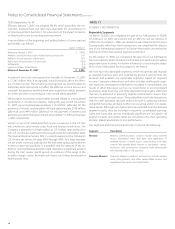
Severance Benefits
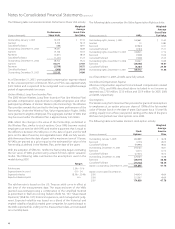
The following table provides an analysis of our severance liability
recorded in accordance with SFAS No. 112, Employers’ Accounting for
Postemployment Benefits (SFAS No. 112):
(dollars in millions)
Year
Beginning
of Year
Charged to
Expense Payments Other End of Year
2005 $ 753 $ 99 $ (251) $ (5) $ 596
2006 596 343 (383) 88 644
2007 644 743 (363) – 1,024
The remaining severance liability is actuarially determined. The 2007
expense includes charges for the involuntary separation of approxi-
mately 9,000 employees, including approximately 4,000 during the
fourth quarter of 2007 and 5,000 expected during 2008. In addition, the
expense includes costs associated with higher assumed attrition beyond
2008. The 2006 expense includes charges for the involuntary separation
of 4,100 employees (see Note 3).