Verizon Wireless 2007 Annual Report Download - page 61
Download and view the complete annual report
Please find page 61 of the 2007 Verizon Wireless annual report below. You can navigate through the pages in the report by either clicking on the pages listed below, or by using the keyword search tool below to find specific information within the annual report.-
 1
1 -
2
-
3
-
4
-
5
-
6
-
7
-
8
-
9
-
10
-
11
-
12
-
13
-
14
-
15
-
16
-
17
-
18
-
19
-
20
-
21
-
22
-
23
-
24
-
25
-
26
-
27
-
28
-
29
-
30
-
31
-
32
-
33
-
34
-
35
-
36
-
37
-
38
-
39
-
40
-
41
-
42
-
43
-
44
-
45
-
46
-
47
-
48
-
49
-
50
-
 51
51 -
 52
52 -
 53
53 -
 54
54 -
 55
55 -
 56
56 -
 57
57 -
 58
58 -
 59
59 -
 60
60 -
 61
61 -
 62
62 -
 63
63 -
 64
64 -
 65
65 -
 66
66 -
 67
67 -
 68
68 -
 69
69 -
 70
70 -
 71
71 -
72
-
73
-
74
-
75
-
76
 |
 |

Notes to Consolidated Financial Statements continued
59
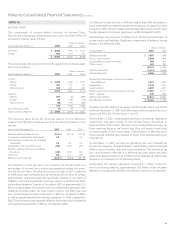
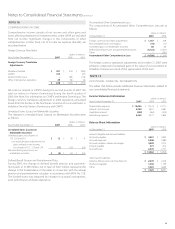
NOTE 13
EARNINGS PER SHARE AND SHAREOWNERS’ INVESTMENT
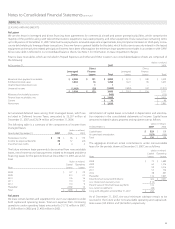
Earnings Per Share
The following table is a reconciliation of the numerators and denomina-
tors used in computing earnings per common share:
(dollars and shares in millions, except per share amounts)
Years Ended December 31, 2007 2006 2005
Income Before Discontinued
Operations, Extraordinary Item and
Cumulative Eect of Accounting
Change $ 5,510 $ 5,480 $ 6,027
After-tax minority interest expense related
to exchangeable equity interest –20 32
After-tax interest expense related to zero-
coupon convertible notes –11 28
Income Before Discontinued
Operations, Extraordinary Item and
Cumulative Eect of Accounting
Change – after assumed conversion
of dilutive securities $ 5,510 $ 5,511 $ 6,087
Weighted-average shares
outstanding – basic 2,898 2,912 2,766
Eect of dilutive securities:
Stock options 41 5
Exchangeable equity interest –18 29
Zero-coupon convertible notes –7 17
Weighted-average shares
outstanding – diluted 2,902 2,938 2,817
Earnings Per Common Share from
Income Before Discontinued
Operations, Extraordinary Item and
Cumulative Eect of Accounting
Change
Basic $ 1.90 $ 1.88 $ 2.18
Diluted $ 1.90 $ 1.88 $ 2.16
Certain outstanding options to purchase shares were not included in
the computation of diluted earnings per common share because they
were not dilutive, including approximately 170 million weighted-average
shares during 2007, 228 million weighted-average shares during 2006
and 250 million shares during 2005.
The zero-coupon convertible notes were retired on May 15, 2006 and
the exchangeable equity interest was converted on August 15, 2006 by
issuing 29.5 million Verizon shares (see Notes 7 and 11).
Shareowners’ Investment
Our certificate of incorporation provides authority for the issuance of up
to 250 million shares of Series Preferred Stock, $.10 par value, in one or
more series, with such designations, preferences, rights, qualifications,
limitations and restrictions as the Board of Directors may determine.
We are authorized to issue up to 4.25 billion shares of common stock.
On February 7, 2008, the Board of Directors replaced the prior share buy
back program with a new program for the repurchase of up to 100 mil-
lion shares of Verizon common stock through the earlier of February 28,
2011 or when the total number of shares repurchased under the new
buy back program aggregates to 100 million.
During 2007, 2006 and 2005, we repurchased approximately 68 million,
50 million and 7.9 million common shares under programs previously
authorized by the Board of Directors.
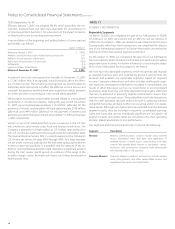
NOTE 14
STOCKBASED COMPENSATION
Refer to Note 1 for a discussion of the adoption of SFAS No. 123(R), which
was effective January 1, 2006.
Verizon Communications Long Term Incentive Plan
The Verizon Communications Long Term Incentive Plan (the Plan), per-
mits the granting of nonqualified stock options, incentive stock options,
restricted stock, restricted stock units, performance shares, performance
share units and other awards. The maximum number of shares for awards
is 207 million.
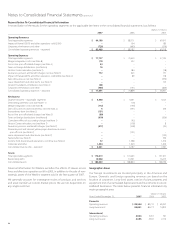
Restricted Stock Units
The Plan provides for grants of restricted stock units (RSUs) that generally
vest at the end of the third year after the grant. The RSUs are classified
as liability awards because the RSUs will be paid in cash upon vesting.
The RSU award liability is measured at its fair value at the end of each
reporting period and, therefore, will fluctuate based on the performance
of Verizon’s stock. Dividend equivalent units are also paid to participants
at the time the RSU award is paid.
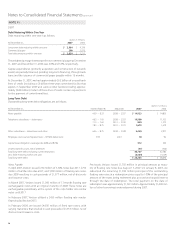
The following table summarizes Verizon’s Restricted Stock Unit activity:
(shares in thousands)
Restricted
Stock Units
Weighted-
Average
Grant-Date
Fair Value
Outstanding, January 1, 2005 525 $ 36.75
Granted 6,410 36.06
Cancelled/Forfeited (66) 36.07
Outstanding, December 31, 2005 6,869 36.12
Granted 9,116 31.88
Cancelled/Forfeited (392) 35.01
Outstanding, December 31, 2006 15,593 33.67
Granted 6,779 37.59
Payments (602) 36.75
Cancelled/Forfeited (197) 34.81
Outstanding, December 31, 2007 21,573 34.80
Performance Share Units
The Plan also provides for grants of performance share units (PSUs) that
generally vest at the end of the third year after the grant. The Human
Resources Committee of the Board of Directors determines the number
of PSUs a participant earns based on Verizon’s Total Shareholder Return
(TSR), as defined in the Plan, for a three-year performance cycle relative
to the total shareholder returns of: the companies in the industry peer
group (60% weight); and the companies in the Standard & Poor’s (S&P)
500 index (40% weight). All payments are subject to approval by the
Human Resources Committee. The PSUs are classified as liability awards
because the PSU awards are paid in cash upon vesting. The PSU award
liability is measured at its fair value at the end of each reporting period
and, therefore, will fluctuate based on the price of Verizon’s stock as well
as Verizon’s TSR relative to the peer group’s TSR and the S&P 500 TSR.
Dividend equivalent units are also paid to participants at the time that
the PSU award is determined and paid, and in the same proportion as
the PSU award.