Verizon Wireless 2007 Annual Report Download - page 29
Download and view the complete annual report
Please find page 29 of the 2007 Verizon Wireless annual report below. You can navigate through the pages in the report by either clicking on the pages listed below, or by using the keyword search tool below to find specific information within the annual report.-
 1
1 -
2
-
3
-
4
-
5
-
6
-
7
-
8
-
9
-
10
-
11
-
12
-
13
-
14
-
15
-
16
-
17
-
18
-
 19
19 -
 20
20 -
 21
21 -
 22
22 -
 23
23 -
 24
24 -
 25
25 -
 26
26 -
 27
27 -
 28
28 -
 29
29 -
 30
30 -
 31
31 -
 32
32 -
 33
33 -
 34
34 -
 35
35 -
 36
36 -
 37
37 -
 38
38 -
 39
39 -
40
-
41
-
42
-
43
-
44
-
45
-
46
-
47
-
48
-
49
-
50
-
51
-
52
-
53
-
54
-
55
-
56
-
57
-
58
-
59
-
60
-
61
-
62
-
63
-
64
-
65
-
66
-
67
-
68
-
69
-
70
-
71
-
72
-
73
-
74
-
75
-
76
 |
 |

27
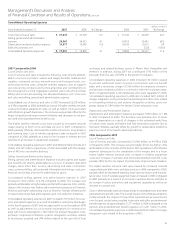
Selling, General and Administrative Expense
Selling, general and administrative expense increased by $1,438 million,
or 11.9% in 2007 compared to 2006. This increase was primarily due to an
increase in salary and benefits expense of $641 million, resulting from an
increase in employees in the sales and customer care areas, and higher
per employee salary and benefit costs. Sales commissions expense
in both our direct and indirect channels increased by $147 million in
2007 compared to 2006, primarily as a result of an increase in customer
renewals and equipment upgrades. Advertising and promotion expense
increased $144 million in 2007, compared to 2006. Also contributing to
the increase were higher costs associated with regulatory fees, which
increased by $127 million in 2007.
Selling, general and administrative expense increased by $1,271 million,
or 11.8% in 2006 compared to 2005. This increase was primarily due to an
increase in salary and benefits expense, as well as advertising and promo-
tion, and regulatory fee increases, compared to 2005.
Depreciation and Amortization Expense
Depreciation and amortization expense increased by $241 million, or
4.9% in 2007 compared to 2006 and increased by $153 million, or 3.2%
in 2006 compared to 2005. These increases were primarily due to an
increase in depreciable assets. Partially offsetting this increase in 2007
was lower amortization expense resulting from customer lists becoming
fully amortized during 2006.
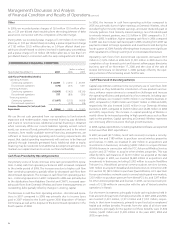
Segment Income
(dollars in millions)
Years Ended December 31, 2007 2006 2005
Segment Income $ 3,794 $ 2,976 $ 2,219
Segment income increased by $818 million, or 27.5% in 2007 compared
to 2006 and increased by $757 million, or 34.1% in 2006 compared to
2005, primarily as a result of the after-tax impact of operating revenues
and operating expenses described above, partially offset by higher
minority interest expense. Segment income in 2006 excludes $42 million
after-taxduetotheadoptionofSFASNo.123(R).
Increases in minority interest expense in 2007 and 2006 were due to
the increased income of the wireless joint venture and the significant
minority interest attributable to Vodafone.
OTHER ITEMS
Merger Integration Costs
In 2007 and 2006, we recorded pretax charges of $178 million ($112 mil-
lion after-tax, or $.04 per diluted share) and $232 million ($146 million
after-tax, or $.05 per diluted share), respectively, primarily associated with
the MCI acquisition in 2006 that were comprised of advertising and other
costs related to re-branding initiatives, facility exit costs and systems inte-
gration activities.
Tax Matters
In December 2007, Verizon received a net distribution from Vodafone
Omnitel of approximately $2.1 billion and we anticipate that we may
receive an additional distribution from Vodafone Omnitel within the next
twelve months. As a result, we recorded $610 million ($.21 per diluted
share) of foreign and domestic taxes and expenses specifically relating to
our share of Vodafone Omnitel’s distributable earnings.
During 2005, we recorded tax benefits of $336 million ($.12 per diluted
share) in connection with the utilization of prior year loss carry forwards.
As a result of the capital gain realized in 2005 in connection with the
sale of our Hawaii businesses, we recorded a tax benefit of $242 million
related to the capital losses incurred in previous years.
Also during 2005, we recorded a net tax provision of $206 million ($.07
per diluted share) related to the repatriation of foreign earnings under
the provisions of the American Jobs Creation Act of 2004, for two of our
foreign investments.
Facility and Employee-Related Items
During the fourth quarter of 2007, we recorded a charge of $772 million
($477 million after-tax, or $.16 per diluted share) primarily in connec-
tion with workforce reductions of 9,000 employees and related charges,
4,000 of whom were terminated in the fourth quarter of 2007 with the
remaining reductions expected to occur throughout 2008. In addition,
we adjusted our actuarial assumptions for severance to align with future
expectations.
During 2006, we recorded net pretax severance, pension and benefits
charges of $425 million ($258 million after-tax, or $.09 per diluted share).
These charges included net pretax pension settlement losses of $56 mil-
lion ($26 million after-tax, or $.01 per diluted share) related to employees
that received lump-sum distributions primarily resulting from our separa-
tion plans. These charges were recorded in accordance with SFAS No. 88,
Employers’ Accounting for Settlements and Curtailments of Defined Benefit
Pension Plans and for Termination (SFAS No. 88), which requires that set-
tlement losses be recorded once prescribed payment thresholds have
been reached. Also included are pretax charges of $369 million ($228
million after-tax, or $.08 per diluted share), for employee severance and
severance-related costs in connection with the involuntary separation of
approximately 4,100 employees. In addition, during 2005 we recorded
a charge of $59 million ($36 million after-tax, or $.01 per diluted share)
associated with employee severance costs and severance-related activi-
ties in connection with the voluntary separation program for surplus
union-represented employees.
During 2006, we recorded pretax charges of $184 million ($118 million
after-tax, or $.04 per diluted share) in connection with the relocation of
employeesandbusinessoperationstoVerizonCenterinBaskingRidge,
New Jersey. During 2005, we recorded a net pretax gain of $18 million
($8 million after-tax) in connection with the relocation, including a pretax
gain of $120 million ($72 million after-tax, or $.03 per diluted share)
related to the sale of a New York City office building, partially offset by
a pretax charge of $102 million ($64 million after-tax, or $.02 per diluted
share), primarily associated with relocation, employee severance and
related activities.
During 2005, we reported a net pretax charge of $98 million ($59 mil-
lion after-tax, or $.02 per diluted share) related to the restructuring of the
Verizon management retirement benefit plans. This pretax charge was
recorded in accordance with SFAS No. 88, and SFAS No. 106, Employers’
Accounting for the Postretirement Benefits Other Than Pensions (SFAS No.
106) and includes the unamortized cost of prior pension enhance-
ments of $430 million offset partially by a pretax curtailment gain of
$332 million related to retiree medical benefits. In connection with this
restructuring, management employees: no longer earn pension benefits
or earn service towards the company retiree medical subsidy after June,
2006; received an 18-month enhancement of the value of their pension
and retiree medical subsidy; and receive a higher savings plan matching
contribution.
Management’s Discussion and Analysis
ofFinancialConditionandResultsofOperations continued