Verizon Wireless 2007 Annual Report Download - page 30
Download and view the complete annual report
Please find page 30 of the 2007 Verizon Wireless annual report below. You can navigate through the pages in the report by either clicking on the pages listed below, or by using the keyword search tool below to find specific information within the annual report.-
 1
1 -
2
-
3
-
4
-
5
-
6
-
7
-
8
-
9
-
10
-
11
-
12
-
13
-
14
-
15
-
16
-
17
-
18
-
19
-
 20
20 -
 21
21 -
 22
22 -
 23
23 -
 24
24 -
 25
25 -
 26
26 -
 27
27 -
 28
28 -
 29
29 -
 30
30 -
 31
31 -
 32
32 -
 33
33 -
 34
34 -
 35
35 -
 36
36 -
 37
37 -
 38
38 -
 39
39 -
 40
40 -
41
-
42
-
43
-
44
-
45
-
46
-
47
-
48
-
49
-
50
-
51
-
52
-
53
-
54
-
55
-
56
-
57
-
58
-
59
-
60
-
61
-
62
-
63
-
64
-
65
-
66
-
67
-
68
-
69
-
70
-
71
-
72
-
73
-
74
-
75
-
76
 |
 |

28
Other
In 2006, we recorded pretax charges of $26 million ($16 million after-
tax, or $.01 per diluted share) resulting from the extinguishment of debt
assumed in connection with the completion of the MCI merger.
During 2005, we recorded pretax charges of $139 million ($133 million
after-tax, or $.05 per diluted share) including a pretax impairment charge
of $125 million ($125 million after-tax, or $.04 per diluted share) per-
taining to aircraft leased to airlines involved in bankruptcy proceedings
and a pretax charge of $14 million ($8 million after-tax, or less than $.01
per diluted share) in connection with the early extinguishment of debt.
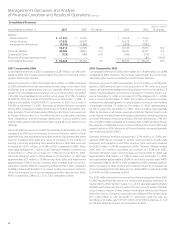
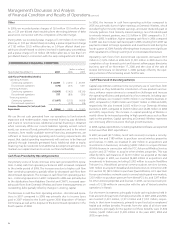
CONSOLIDATED FINANCIAL CONDITION
(dollars in millions)
Years Ended December 31, 2007 2006 2005
Cash Flows Provided By (Used In)
Operating Activities:
Continuing operations $ 26,309 $ 23,030 $ 20,444
Discontinued operations (570) 1,076 1,581
Investing Activities:
Continuing operations (16,865) (17,422) (18,136)
Discontinued operations 757 1,806 (356)
Financing activities:
Continuing operations (11,697) (5,752) (4,958)
Discontinued operations –(279) (76)
Increase (Decrease) In Cash and Cash
Equivalents $ (2,066) $ 2,459 $ (1,501)
We use the net cash generated from our operations to fund network
expansion and modernization, repay external financing, pay dividends
and invest in new businesses. Additional external financing is obtained
when necessary. While our current liabilities typically exceed current
assets, our sources of funds, primarily from operations and, to the extent
necessary, from readily available external financing arrangements, are
sufficient to meet ongoing operating and investing requirements. We
expect that capital spending requirements will continue to be financed
primarily through internally generated funds. Additional debt or equity
financing may be needed to fund additional development activities or to
maintain our capital structure to ensure our financial flexibility.
Cash Flows Provided By Operating Activities
Our primary source of funds continues to be cash generated from opera-
tions. In total, cash from operating activities in 2007 increased compared
to the similar period of 2006. The increase was due to higher cash flow
from continuing operations, partially offset by decreased cash flow from
discontinued operations. The increase in cash flow from operating activi-
ties – continuing operations in 2007 compared to 2006 was primarily due
to the distributions from Vodafone Omnitel and CANTV, increased oper-
ating cash flows from Domestic Wireless and lower interest payments on
outstanding debt, partially offset by changes in working capital.
The decrease in cash flow from operating activities - discontinued opera-
tions in 2007 compared to 2006 was primarily due to income taxes
paid in 2007 related to the fourth quarter 2006 disposition of Verizon
Dominicana, as well as the disposal of the discontinued operations in the
fourth quarter of 2006.
In 2006, the increase in cash from operating activities compared to
2005 was primarily due to higher earnings at Domestic Wireless, which
included higher minority interest earnings, and lower dividends paid to
minority partners. Total minority interest earnings, net of dividends paid
to minority interest partners, was $3.2 billion in 2006 compared to $1.7
billion in 2005. In addition, higher operating cash flow in 2006 compared
to 2005 was due to lower cash taxes paid in 2006, resulting from 2005 tax
payments related to foreign operations and investments sold during the
fourth quarter of 2004. Partially offsetting these increases were significant
2005 repatriations of foreign earnings of unconsolidated businesses.
Operating cash flows from discontinued operations decreased $505
million to $1,076 million in 2006 from $1,581 million in 2005 due to the
completion of our domestic print and Internet yellow pages directories
business spin-off on November 17, 2006 and the close of the sale of
Verizon Dominicana on December 1, 2006, partially offset by the oper-
ating activities of the remaining assets held for sale.
Cash Flows Used In Investing Activities
Capital expenditures continue to be our primary use of cash flows from
operations, as they facilitate the introduction of new products and ser-
vices, enhance responsiveness to competitive challenges and increase
the operating efficiency and productivity of our networks. Including capi-
talized software, we invested $10,956 million in our Wireline business in
2007, compared to $10,259 million and $8,267 million in 2006 and 2005,
respectively. We also invested $6,503 million in our Domestic Wireless
business in 2007, compared to $6,618 million and $6,484 million in 2006
and 2005, respectively. The increase in capital spending at Wireline is
mainly driven by increased spending in high growth areas such as fiber
optic to the premises. Capital spending at Domestic Wireless represents
our continuing effort to invest in this high growth business.
In 2008, capital expenditures, including capitalized software, are expected
to be lower than 2007 expenditures.
In 2007, we paid $417 million, net of cash received, to acquire a security-
services firm and $180 million to purchase several wireless properties
and licenses. In 2006, we invested $1,422 million in acquisitions and
investments in businesses, including $2,809 million to acquire thirteen
20 MHz licenses in connection with the FCC Advanced Wireless Services
auction and $57 million to acquire other wireless properties. This was
offset by MCI’s cash balances of $2,361 million we acquired at the date
of the merger. In 2005, we invested $4,684 million in acquisitions and
investments in businesses, including $3,003 million to acquire NextWave
Telecom Inc. (NextWave) personal communications services licenses,
$641 million to acquire 63 broadband wireless licenses in connection with
FCC auction 58, $419 million to purchase Qwest Wireless, LLC’s spectrum
licenses and wireless network assets in several existing and new markets,
$230 million to purchase spectrum from MetroPCS, Inc. and $297 million
for other wireless properties and licenses. In 2005, we received cash pro-
ceeds of $1,326 million in connection with the sale of Verizon’s wireline
operations in Hawaii.
Our short-term investments principally include cash equivalents held in
trust accounts for payment of employee benefits. In 2007, 2006 and 2005,
we invested $1,693 million, $1,915 million and $1,955 million, respec-
tively, in short-term investments, primarily to pre-fund active employees’
health and welfare benefits. Proceeds from the sales of all short-term
investments, principally for the payment of these benefits, were $1,862
million, $2,205 million and $1,609 million in the years 2007, 2006 and
2005, respectively.
Management’s Discussion and Analysis
ofFinancialConditionandResultsofOperations continued