Verizon Wireless 2007 Annual Report Download - page 67
Download and view the complete annual report
Please find page 67 of the 2007 Verizon Wireless annual report below. You can navigate through the pages in the report by either clicking on the pages listed below, or by using the keyword search tool below to find specific information within the annual report.-
 1
1 -
2
-
3
-
4
-
5
-
6
-
7
-
8
-
9
-
10
-
11
-
12
-
13
-
14
-
15
-
16
-
17
-
18
-
19
-
20
-
21
-
22
-
23
-
24
-
25
-
26
-
27
-
28
-
29
-
30
-
31
-
32
-
33
-
34
-
35
-
36
-
37
-
38
-
39
-
40
-
41
-
42
-
43
-
44
-
45
-
46
-
47
-
48
-
49
-
50
-
51
-
52
-
53
-
54
-
55
-
56
-
 57
57 -
 58
58 -
 59
59 -
 60
60 -
 61
61 -
 62
62 -
 63
63 -
 64
64 -
 65
65 -
 66
66 -
 67
67 -
 68
68 -
 69
69 -
 70
70 -
 71
71 -
 72
72 -
 73
73 -
 74
74 -
 75
75 -
 76
76
 |
 |

Notes to Consolidated Financial Statements continued
65
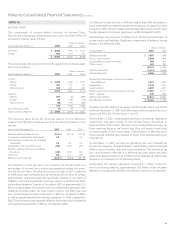
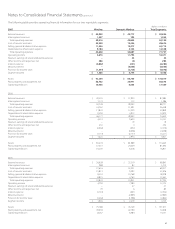
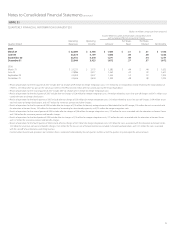
NOTE 16
INCOME TAXES
The components of Income Before Provision for Income Taxes,
Discontinued Operations, Extraordinary Item and Cumulative Effect of
Accounting Change are as follows:
(dollars in millions)
Years Ended December 31, 2007 2006 2005
Domestic $ 8,508 $ 7,000 $ 7,707
Foreign 984 1,154 741
$ 9,492 $ 8,154 $ 8,448
The components of the provision for income taxes from continuing oper-
ations are as follows:
(dollars in millions)
Years Ended December 31, 2007 2006 2005
Current
Federal $ 2,568 $ 2,364 $ 2,772
Foreign 461 141 81
State and local 545 421 661
3,574 2,926 3,514
Deferred
Federal 397 (9) (844)
Foreign 66 (45) (55)
State and local (48) (191) (187)
415 (245) (1,086)
Investment tax credits (7) (7) (7)
Total income tax expense $ 3,982 $ 2,674 $ 2,421
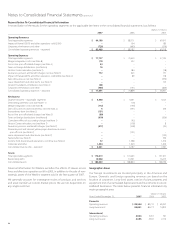
The following table shows the principal reasons for the difference
between the effective income tax rate and the statutory federal income
tax rate:
Years Ended December 31, 2007 2006 2005
Statutory federal income tax rate 35.0 % 35.0 % 35.0 %
Distributions from foreign investments 5.9 – 2.0
State and local income tax, net of federal
tax benets 3.4 1.8 3.6
Tax benets from investment losses (0.8) (0.9) (4.5)
Equity in earnings from unconsolidated
businesses (2.3) (3.8) (3.5)
Other, net 0.8 0.7 (3.9)
Eective income tax rate 42.0 % 32.8 % 28.7 %
The effective income tax rate is the provision for income taxes as a
percentage of income from continuing operations before the provi-
sion for income taxes. The effective income tax rate in 2007 compared
to 2006 was higher primarily due to recording $610 million of foreign
and domestic taxes and expenses specifically relating to our share of
Vodafone Omnitel’s distributable earnings. Verizon received a net distri-
bution from Vodafone Omnitel in December 2007 of approximately $2.1
billion and anticipates that it may receive an additional distribution from
Vodafone Omnitel within the next twelve months. The 2007 rate was
also increased due to higher state taxes in 2007 as compared to 2006,
as well as greater benefits from foreign operations in 2006 compared to
2007. These increases were partially offset by lower expenses recorded for
unrecognized tax benefits in 2007 as compared to 2006.
Our effective income tax rate in 2006 was higher than 2005 primarily as a
result of favorable tax settlements and the recognition of capital loss carry
forwards in 2005. These increases were partially offset by tax benefits from
foreign operations and lower state taxes in 2006 compared to 2005.
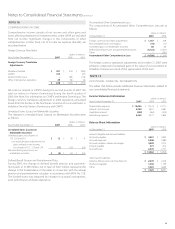
Deferred taxes arise because of differences in the book and tax bases of
certain assets and liabilities. Significant components of deferred tax are
shown in the following table:
(dollars in millions)
At December 31, 2007 2006
Employee benets $ 7,067 $ 7,788
Tax loss carry forwards 2,868 2,994
Uncollectible accounts receivable 400 455
Other – assets 422 903
10,757 12,140
Valuation allowance (2,671) (2,600)
Deferred tax assets 8,086 9,540
Former MCI intercompany accounts receivable
basis dierence 1,977 2,003
Depreciation 7,045 7,617
Leasing activity 2,307 2,674
Wireless joint venture including wireless licenses 11,634 12,177
Other – liabilities 349 2,493
Deferred tax liabilities 23,312 26,964
Net deferred tax liability $ 15,226 $ 17,424
Employee benefits deferred tax assets include $4,929 million and $5,590
million at December 31, 2007 and 2006, respectively, recognized in accor-
dance with SFAS No. 158 (see Notes 1 and 15).
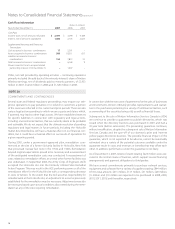
At December 31, 2007, undistributed earnings of our foreign subsidiaries
indefinitely invested outside of the United States amounted to
approximately $900 million. We have not provided deferred taxes on
these earnings because we intend that they will remain indefinitely
invested outside of the United States. Determination of the amount of
unrecognized deferred taxes related to these undistributed earnings is
not practical.
At December 31, 2007, we had net operating loss carry forwards for
income tax purposes of approximately $3,600 million, expiring through
2026 in various foreign, state and local jurisdictions. The amount of tax
loss carry forwards reflected as a deferred tax asset above has been
reduced by approximately $1,017 million due to federal and state tax law
limitations on utilization of net operating losses.
During 2007, the valuation allowance increased $71 million. Under cur-
rent accounting guidelines, approximately $2.0 billion of the valuation
allowance, if recognized, would be recorded as a reduction of goodwill.