Verizon Wireless 2007 Annual Report Download - page 27
Download and view the complete annual report
Please find page 27 of the 2007 Verizon Wireless annual report below. You can navigate through the pages in the report by either clicking on the pages listed below, or by using the keyword search tool below to find specific information within the annual report.-
 1
1 -
2
-
3
-
4
-
5
-
6
-
7
-
8
-
9
-
10
-
11
-
12
-
13
-
14
-
15
-
16
-
 17
17 -
 18
18 -
 19
19 -
 20
20 -
 21
21 -
 22
22 -
 23
23 -
 24
24 -
 25
25 -
 26
26 -
 27
27 -
 28
28 -
 29
29 -
 30
30 -
 31
31 -
 32
32 -
 33
33 -
 34
34 -
 35
35 -
 36
36 -
 37
37 -
38
-
39
-
40
-
41
-
42
-
43
-
44
-
45
-
46
-
47
-
48
-
49
-
50
-
51
-
52
-
53
-
54
-
55
-
56
-
57
-
58
-
59
-
60
-
61
-
62
-
63
-
64
-
65
-
66
-
67
-
68
-
69
-
70
-
71
-
72
-
73
-
74
-
75
-
76
 |
 |

25
former MCI business subsequent to the close of the merger on January
6, 2006. The IP suite of products is Enterprise Business’ fastest growing
set of product offerings and includes Private IP, IP VPN, Web Hosting and
VoIP. Our Enterprise Business channel services many customer accounts
that are moving from core data products to IP based products. This shift
in technology is occurring across our customer base. Enterprise Business
2006 revenues of $14,296 million increased $7,911 million, or 123.9%
compared to 2005 primarily due to the acquisition of MCI.
Wholesale
Our Wholesale revenues relate to domestic wholesale services and
include all interexchange wholesale traffic sold in the United States, as
well as internationally destined traffic that originates in the United States.
The Wholesale line of business is comprised of numerous large and small
customers that predominately resell voice services to their own customer
base. A portion of this revenue is generated by a few large telecommuni-
cation carriers, many of whom compete directly with Verizon.
Verizon Business 2007 Wholesale revenues of $3,345 million increased
by $64 million, or 2.0% as compared to 2006, primarily due to increased
MOUs in traditional voice products, partially offset by continued rate com-
pression due to competition in the marketplace. During 2006, Verizon
Business Wholesale revenues of $3,281 million, increased $1,895 million,
or 136.7%, compared to 2005, primarily due to the MCI acquisition.
International and Other
Our International operations serve retail and wholesale customers,
including enterprise businesses, government entities and telecommu-
nication carriers outside of the United States, primarily in Europe, the
Middle East and Africa, the Asia Pacific region, Latin America and Canada.
These operations provide telecommunications services, which include
voice, data services, Internet and managed network services.
International and other revenues of $3,214 million during 2007 increased
by$113million,or3.6%ascomparedto2006.Revenuegrowthinourstra-
tegic products, specifically IP services, was partially offset by competitive
rate compression and lower volumes with respect to our voice products.
Our revenues from International and Other in the year ended December
31, 2006 were $3,101 million. This market represented a new revenue
stream to Verizon resulting from the MCI acquisition on January 6, 2006.
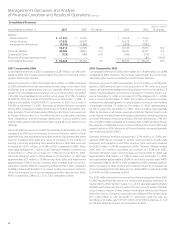
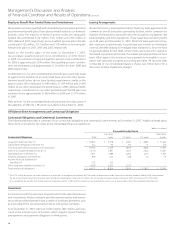
Operating Expenses
(dollars in millions)
Years Ended December 31, 2007 2006 2005
Cost of services and sales $ 25,220 $ 24,767 $ 15,813
Selling, general and administrative expense 11,236 11,820 8,210
Depreciation and amortization expense 9,184 9,590 8,801
$ 45,640 $ 46,177 $ 32,824
Cost of Services and Sales
Cost of services and sales includes the following costs directly attribut-
able to a service or product: salaries and wages, benefits, materials and
supplies, contracted services, network access and transport costs, cus-
tomer provisioning costs, computer systems support, costs to support
our outsourcing contracts and technical facilities, contributions to the
universal service fund, customer provisioning costs and cost of products
sold. Aggregate customer care costs, which include billing and service
provisioning, are allocated between cost of services and sales and selling,
general and administrative expense.
Cost of services and sales increased by $453 million, or 1.8%, during 2007
compared to 2006. This increase was primarily due to higher costs asso-
ciated with our growth businesses, annual wage increases and higher
customer premise equipment costs, partially offset by productivity
improvement initiatives and lower switched access lines in service, as
well as lower wholesale voice connections.
Cost of services and sales increased by $8,954 million, or 56.6%, in 2006
compared to 2005. These increases were primarily due to the MCI merger
in 2006 partially offset by the net impact of other cost changes. Higher
costs associated with our growth businesses and annual wage increases
were partially offset by productivity improvement initiatives, which
reduced cost of services and sales expenses in 2006. Expenses were also
impacted by increased net pension and other postretirement benefit
costs. The overall impact of the 2006 assumption changes, combined with
the impact of lower than expected actual asset returns over the past sev-
eral years, resulted in pension and other postretirement benefit expense
of $1,408 million in 2006 compared to net pension and postretirement
benefit expense of $1,248 million in 2005. Expenses decreased in 2006
due to the discontinuation of non-strategic businesses, including the ter-
mination of a large commercial inventory management contract in 2005.
Selling, General and Administrative Expense
Selling, general and administrative expense includes salaries, wages
and benefits not directly attributable to a service or product, bad debt
charges, taxes other than income, advertising and sales commission
costs, customer billing, call center and information technology costs, pro-
fessional service fees and rent for administrative space.
Selling, general and administrative expenses in 2007 decreased by $584
million or 4.9%, in 2007 compared to 2006. The decrease was primarily
due to cost reduction initiatives, as well as the impact of gains from real
estate sales and lower bad debt costs, partially offset by higher adver-
tising costs and the inclusion of the results of operations of the former
MCI business subsequent to the close of the merger on January 6, 2006.
Selling, general and administrative expenses in 2006 increased by $3,610
million, or 44.0% compared to 2005. These increases were primarily due
to the inclusion of expenses from the former MCI in 2006, partially offset
by synergy savings resulting from our merger integration efforts, the
impact of gains from real estate sales and lower bad debt costs.
Depreciation and Amortization Expense
The decrease in depreciation and amortization expense of $406 million,
or 4.2%, in 2007 compared to 2006 was mainly driven by lower rates of
depreciation as a result of changes in the estimated useful lives of certain
asset classes, partially offset by growth in depreciable telephone plant
from increased capital spending. The increase in depreciation and amor-
tization expense of $789 million, or 9.0% in 2006 compared to 2005 was
mainly driven by the acquisition of MCI’s depreciable property and equip-
ment and finite-lived intangible assets, including its customer lists and
capitalized non-network software, and by growth in depreciable tele-
phone plant and non-network software assets.
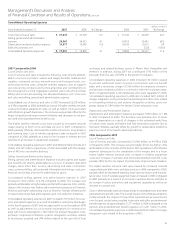
Segment Income
(dollars in millions)
Years Ended December 31, 2007 2006 2005
Segment Income $ 1,506 $ 1,625 $ 1,906
Management’s Discussion and Analysis
ofFinancialConditionandResultsofOperations continued