Walmart 2011 Annual Report Download - page 17
Download and view the complete annual report
Please find page 17 of the 2011 Walmart annual report below. You can navigate through the pages in the report by either clicking on the pages listed below, or by using the keyword search tool below to find specific information within the annual report.-
 1
1 -
2
-
3
-
4
-
5
-
6
-
 7
7 -
 8
8 -
 9
9 -
 10
10 -
 11
11 -
 12
12 -
 13
13 -
 14
14 -
 15
15 -
 16
16 -
 17
17 -
 18
18 -
 19
19 -
 20
20 -
 21
21 -
 22
22 -
 23
23 -
 24
24 -
 25
25 -
 26
26 -
 27
27 -
28
-
29
-
30
-
31
-
32
-
33
-
34
-
35
-
36
-
37
-
38
-
39
-
40
-
41
-
42
-
43
-
44
-
45
-
46
-
47
-
48
-
49
-
50
-
51
-
52
-
53
-
54
-
55
-
56
-
57
-
58
-
59
-
60
-
61
-
62
 |
 |

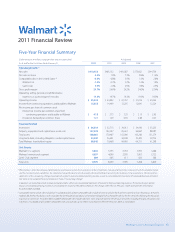
Walmart 2011 Annual Report 15
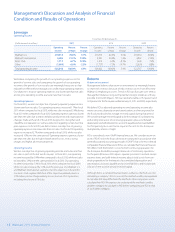
Five-Year Financial Summary
(Dollar amounts in millions, except per share and unit count data) As Adjusted
As of and for the Fiscal Years Ended January 31, 2011 2010 2009 2008 2007
Operating Results
(1)
Net sales $418,952 $405,132 $401,087 $373,821 $344,759
Net sales increase 3.4% 1.0% 7.3% 8.4% 11.6%
Comparable sales in the United States
(2)
-0.6% -0.8% 3.5% 1.6% 2.0%
Walmart U.S. -1.5% -0.7% 3.2% 1.0% 1.9%
Sam’s Club 3.9% -1.4% 4.9% 4.9% 2.5%
Gross prot margin 24.7% 24.9% 24.2% 24.0% 23.4%
Operating, selling, general and administrative
expenses, as a percentage of net sales 19.3% 19.7% 19.3% 19.0% 18.5%
Operating income $ 25,542 $ 24,002 $ 22,767 $ 21,916 $ 20,552
Income from continuing operations attributable to Walmart 15,355 14,449 13,235 12,841 12,224
Net income per share of common stock:
Diluted net income per common share from
continuing operations attributable to Walmart $ 4.18 $ 3.73 $ 3.35 $ 3.15 $ 2.93
Dividends declared per common share 1.21 1.09 0.95 0.88 0.67
Financial Position
Inventories $ 36,318 $ 32,713 $ 34,013 $ 34,690 $ 33,235
Property, equipment and capital lease assets, net 107,878 102,307 95,653 96,867 88,287
Total assets 180,663 170,407 163,096 163,200 151,274
Long-term debt, including obligations under capital leases 43,842 36,401 34,549 33,402 30,735
Total Walmart shareholders’ equity 68,542 70,468 64,969 64,311 61,298
Unit Counts
Walmart U.S. segment 3,804 3,755 3,703 3,595 3,488
Walmart International segment 4,557 4,099 3,595 3,093 2,733
Sam’s Club segment 609 605 611 600 588
Total units 8,970 8,459 7,909 7,288 6,809
(1)
Effective May 1, 2010, the Company implemented a new financial system for its operations in the United States, Canada and Puerto Rico. Concurrent with this implementation
and the increased system capabilities, the Company changed the level at which we apply the retail method of accounting for inventory in these operations. The retrospective
application of this accounting change impacted both segment and consolidated operating income, as well as consolidated net income for all comparable periods presented.
See “Notes to Consolidated Financial Statements,” Note 2. “Accounting Change.”
(2)
Comparable store and club sales include fuel. Fiscal 2008 and fiscal 2007 comparable sales include all stores and clubs that have been open for at least the previous 12 months.
Additionally, for those fiscal years, stores and clubs that are relocated, expanded or converted are excluded from comparable sales for the first 12 months following the relocation,
expansion or conversion. Fiscal 2011, 2010 and 2009 comparable sales include sales from stores and clubs open for the previous 12 months, including remodels, relocations and
expansions. Fiscal 2008 and fiscal 2007 comparable store and club sales do not reflect reclassifications effective February 1, 2009, as noted above.
2011 Financial Review
In addition, we reclassified certain revenue and expense items within our Consolidated Statements of Income for financial reporting purposes. The reclassifications did not
impact consolidated operating income or consolidated net income attributable to Walmart. The changes were effective February 1, 2009 and have been reflected for
fiscal 2010, 2009 and 2008.