Walmart 2011 Annual Report Download - page 36
Download and view the complete annual report
Please find page 36 of the 2011 Walmart annual report below. You can navigate through the pages in the report by either clicking on the pages listed below, or by using the keyword search tool below to find specific information within the annual report.-
 1
1 -
2
-
3
-
4
-
5
-
6
-
7
-
8
-
9
-
10
-
11
-
12
-
13
-
14
-
15
-
16
-
17
-
18
-
19
-
20
-
21
-
22
-
23
-
24
-
25
-
 26
26 -
 27
27 -
 28
28 -
 29
29 -
 30
30 -
 31
31 -
 32
32 -
 33
33 -
 34
34 -
 35
35 -
 36
36 -
 37
37 -
 38
38 -
 39
39 -
 40
40 -
 41
41 -
 42
42 -
 43
43 -
 44
44 -
 45
45 -
 46
46 -
47
-
48
-
49
-
50
-
51
-
52
-
53
-
54
-
55
-
56
-
57
-
58
-
59
-
60
-
61
-
62
 |
 |

34 Walmart 2011 Annual Report
1 Summary of Signicant Accounting Policies
General
Wal-Mart Stores, Inc. (“Walmart,” the “Company” or “we”) operates retail
stores in various formats around the world, aggregated into three report-
able segments: (1) the Walmart U.S. segment; (2) the Walmart International
segment; and (3) the Sam’s Club segment. We are committed to saving
people money so they can live better. We earn the trust of our customers
every day by providing a broad assortment of quality merchandise and
services at every day low prices (“EDLP”) while fostering a culture that
rewards and embraces mutual respect, integrity and diversity. EDLP is
our pricing philosophy under which we price items at a low price every
day so our customers trust that our prices will not change under frequent
promotional activity. Our scal year ends on January 31.
Principles of Consolidation
The consolidated nancial statements include the accounts of Wal-Mart
Stores, Inc. and its subsidiaries. All material intercompany accounts and
transactions have been eliminated in consolidation. Investments in
unconsolidated aliates, which are 50% or less owned and do not meet
the consolidation criteria of Topic 810 of the Financial Accounting Stan-
dards Codication (“ASC”) are accounted for using the equity method.
These investments are immaterial to our consolidated nancial statements.
The Company’s operations in Argentina, Brazil, Chile, China, Costa Rica,
El Salvador, Guatemala, Honduras, India, Japan, Mexico, Nicaragua and the
United Kingdom are consolidated using a December 31 scal year-end,
generally due to statutory reporting requirements. There were no signi-
cant intervening events during January 2011 which materially aected the
consolidated nancial statements. The Company’s operations in the United
States and Canada are consolidated using a January 31 scal year-end.
Use of Estimates
The consolidated nancial statements have been prepared in conformity
with accounting principles generally accepted in the United States. Those
principles require management to make estimates and assumptions that
aect the reported amounts of assets and liabilities. Management’s esti-
mates and assumptions also aect the disclosure of contingent assets
and liabilities at the date of the nancial statements and the reported
amounts of revenues and expenses during the reporting period. Actual
results may dier from those estimates.
Cash and Cash Equivalents
The Company considers investments with a maturity of three months or
less when purchased to be cash equivalents. All credit card, debit card
and EBT transactions that process in less than seven days are classied as
cash and cash equivalents. The amounts due from banks for these trans-
actions classied as cash totaled $1.2 billion and $2.6 billion at January 31,
2011 and 2010, respectively. In addition, cash and cash equivalents
includes restricted cash related to cash collateral holdings from various
counterparties as required by certain derivative and trust agreements of
$504 million and $469 million at January 31, 2011 and 2010, respectively.
Receivables
Receivables consist primarily of amounts due from:
• insurance companies resulting from our pharmacy sales;
• banks for customer credit card, debit card and electronic bank transfers
that take in excess of seven days to process;
• suppliers for marketing or incentive programs;
• consumer nancing programs in certain international subsidiaries; and
• real estate transactions.
We establish a reserve for uncollectible receivables based on historical
trends in collection of past due amounts and write-o history. Our over-
all reserve for uncollectible receivables was $252 million and $298 million
at January 31, 2011 and 2010, respectively.
Our Walmart International segment oers a limited amount of consumer
credit products, principally through our subsidiaries in Chile, Canada and
Mexico. At January 31, 2011, the balance of these receivables was $673 mil-
lion, net of its reserve for doubtful accounts of $83 million, and is included
in receivables, net on the accompanying consolidated balance sheet.
Inventories
The Company values inventories at the lower of cost or market as
determined primarily by the retail method of accounting, using the last-in,
rst-out (“LIFO”) method for substantially all of the Walmart U.S. segment’s
merchandise inventories. The retail method of accounting results in
inventory being valued at the lower of cost or market since permanent
markdowns are currently taken as a reduction of the retail value of
inventory. The Sam’s Club segment’s merchandise is valued based on
the weighted-average cost using the LIFO method. Inventories for the
Walmart International operations are primarily valued by the retail
method of accounting and are stated using the rst-in, rst-out (“FIFO”)
method. At January 31, 2011 and 2010, our inventories valued at LIFO
approximate those inventories as if they were valued at FIFO.
As discussed in Note 2, eective May 1, 2010, the Company changed the
level at which it applies the retail method for valuing inventory for its
operations in the United States, Canada, and Puerto Rico. The retrospec-
tive application of this accounting change impacted both segment and
consolidated operating income, as well as consolidated net income for
all comparable periods presented.
Property and Equipment
Property and equipment are stated at cost. Gains or losses on disposition
are recognized as earned or incurred. Costs of major improvements are
capitalized, while costs of normal repairs and maintenance are charged
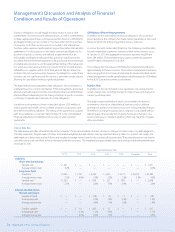
to expense as incurred. Property and equipment are generally depreci-
ated over the following estimated useful lives on a straight-line basis:
Buildings and improvements 3–40years
Fixtures and equipment 3–25years
Transportation equipment 4–15years
Leasehold improvements are depreciated over the shorter of the estimated
useful life of the asset or the remaining expected lease term. If signicant
expenditures are made for leasehold improvements late in the expected
term of a lease and renewal is reasonably assured, the useful life of the
leasehold improvement is limited to the end of the renewal period or
economic life of the asset, whichever is shorter. Depreciation expense,
including amortization of property under capital leases, for scal years
2011, 2010 and 2009 was $7.6 billion, $7.2 billion and $6.7 billion, respectively.
Notes to Consolidated Financial Statements