Walmart 2011 Annual Report Download - page 20
Download and view the complete annual report
Please find page 20 of the 2011 Walmart annual report below. You can navigate through the pages in the report by either clicking on the pages listed below, or by using the keyword search tool below to find specific information within the annual report.-
 1
1 -
2
-
3
-
4
-
5
-
6
-
7
-
8
-
9
-
 10
10 -
 11
11 -
 12
12 -
 13
13 -
 14
14 -
 15
15 -
 16
16 -
 17
17 -
 18
18 -
 19
19 -
 20
20 -
 21
21 -
 22
22 -
 23
23 -
 24
24 -
 25
25 -
 26
26 -
 27
27 -
 28
28 -
 29
29 -
 30
30 -
31
-
32
-
33
-
34
-
35
-
36
-
37
-
38
-
39
-
40
-
41
-
42
-
43
-
44
-
45
-
46
-
47
-
48
-
49
-
50
-
51
-
52
-
53
-
54
-
55
-
56
-
57
-
58
-
59
-
60
-
61
-
62
 |
 |

Management’s Discussion and Analysis of Financial
Condition and Results of Operations
18 Walmart 2011 Annual Report
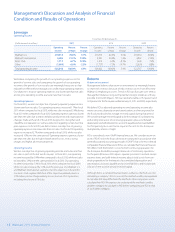
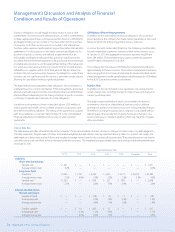
Leverage
Operating Income
Fiscal Years Ended January 31,
(Dollar amounts in millions)
2011 2010 2009
Operating Percent Percent Operating Percent Percent Operating Percent
Income of Total Change Income of Total Change Income of Total
Walmart U.S. $19,914 78.0% 3.1% $19,313 80.5% 5.5% $18,310 80.4%
Walmart International 5,606 21.9% 14.4% 4,901 20.4% 1.4% 4,832 21.2%
Sam’s Club 1,711 6.7% 12.9% 1,515 6.3% -8.1% 1,649 7.2%
Other (1,689) -6.6% -2.2% (1,727) -7.2% -14.7% (2,024) -8.8%
Total operating income $25,542 100.0% 6.4% $24,002 100.0% 5.4% $22,767 100.0%
We believe comparing the growth of our operating expenses to the
growth of our net sales and comparing the growth of our operating
income to the growth of our net sales are meaningful measures as they
indicate how eectively we manage costs and leverage operating expenses.
Our objective is to grow operating expenses at a slower rate than net sales
and to grow operating income at a faster rate than net sales.
Operating Expenses
For scal 2011, we met our objective of growing operating expenses at a
slower rate than net sales. Our operating expenses increased 1.7% in scal
2011 when compared to scal 2010, while net sales increased 3.4% during
scal 2011 when compared to scal 2010. Operating expenses grew at a slower
rate than net sales due to improved labor productivity and organizational
changes made at the end of scal 2010 designed to strengthen and
streamline our operations, as well as a reduction regarding certain incentive
plan expenses. In scal 2010, we did not meet our objective of growing
operating expenses at a slower rate than net sales. Our scal 2010 operating
expenses increased 2.7% when compared to scal 2009, while net sales
increased 1.0% over the same period. Operating expenses grew at a faster
rate than net sales due to higher health benet costs, restructuring
charges and higher advertising expenses.
Operating Income
We met our objective of growing operating income at a faster rate than
net sales in each of the last two scal years. In scal 2011, our operating
income increased by 6.4% when compared to scal 2010, while net sales
increased by 3.4% over the same period in scal 2010. Our operating
income increased by 5.4% in scal 2010 when compared to scal 2009,
while net sales increased by 1.0% over the prior year. Our Walmart U.S.
and Walmart International segments met this objective in scal 2010.
Our Sam’s Club segment fell short of this objective primarily due to a
$174 million pre-tax charge relating to a restructure of its operations,
including the closure of 10 clubs.
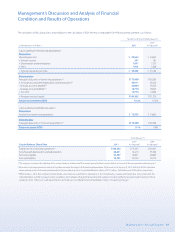
Returns
Return on Investment
Management believes that return on investment is a meaningful metric
to share with investors because it helps investors assess how eectively
Walmart is employing its assets. Trends in ROI can uctuate over time as
management balances long-term potential strategic initiatives with any
possible short-term impacts. ROI was relatively stable at 19.2 percent and
19.3 percent for the scal years ended January 31, 2011 and 2010, respectively.
We dene ROI as adjusted operating income (operating income plus
interest income, depreciation and amortization, and rent expense) for
the scal year divided by average invested capital during that period.
We consider average invested capital to be the average of our beginning
and ending total assets of continuing operations plus accumulated
depreciation and amortization less accounts payable and accrued liabilities
for that period, plus a rent factor equal to the rent for the scal year
multiplied by a factor of eight.
ROI is considered a non-GAAP nancial measure. We consider return on
assets (“ROA”) to be the nancial measure computed in accordance with
generally accepted accounting principles (“GAAP”) that is the most directly
comparable nancial measure to ROI as we calculate that nancial measure.
ROI diers from ROA (which is income from continuing operations for
the scal year divided by average total assets of continuing operations
for the period) because ROI: adjusts operating income to exclude certain
expense items and adds interest income; adjusts total assets from con-
tinuing operations for the impact of accumulated depreciation and
amortization, accounts payable and accrued liabilities; and incorporates
a factor of rent to arrive at total invested capital.
Although ROI is a standard nancial metric, numerous methods exist for
calculating a company’s ROI. As a result, the method used by management
to calculate ROI may dier from the methods other companies use to
calculate their ROI. We urge you to understand the methods used by
another company to calculate its ROI before comparing our ROI to that
of such other company.