Walmart 2011 Annual Report Download - page 19
Download and view the complete annual report
Please find page 19 of the 2011 Walmart annual report below. You can navigate through the pages in the report by either clicking on the pages listed below, or by using the keyword search tool below to find specific information within the annual report.-
 1
1 -
2
-
3
-
4
-
5
-
6
-
7
-
8
-
 9
9 -
 10
10 -
 11
11 -
 12
12 -
 13
13 -
 14
14 -
 15
15 -
 16
16 -
 17
17 -
 18
18 -
 19
19 -
 20
20 -
 21
21 -
 22
22 -
 23
23 -
 24
24 -
 25
25 -
 26
26 -
 27
27 -
 28
28 -
 29
29 -
30
-
31
-
32
-
33
-
34
-
35
-
36
-
37
-
38
-
39
-
40
-
41
-
42
-
43
-
44
-
45
-
46
-
47
-
48
-
49
-
50
-
51
-
52
-
53
-
54
-
55
-
56
-
57
-
58
-
59
-
60
-
61
-
62
 |
 |

Management’s Discussion and Analysis of Financial
Condition and Results of Operations
Walmart 2011 Annual Report 17
internet-based retailers and catalog businesses. We compete with a number
of companies for prime retail site locations, as well as in attracting and
retaining quality employees (whom we call “associates”). We, along with
other retail companies, are inuenced by a number of factors including,
but not limited to: general economic conditions, cost of goods, consumer
disposable income, consumer debt levels and buying patterns, consumer
credit availability, interest rates, customer preferences, unemployment,
labor costs, ination, deation, currency exchange uctuations, fuel and
energy prices, weather patterns, climate change, catastrophic events,
competitive pressures and insurance costs. Further information on certain
risks to our Company can be located in “Item 1A. Risk Factors” in our
Annual Report on Form 10-K for the scal year ended January 31, 2011.
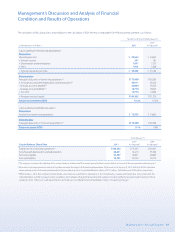
Company Performance Metrics
The Company’s performance metrics emphasize three priorities for improving
shareholder value: Growth, Leverage and Returns. The Company’s priority
of growth focuses on sales through comparable store and club sales and
unit square feet growth; the priority of leverage encompasses the
Company’s objective to increase its operating income at a faster rate than
the growth in net sales by growing its operating, selling, general and
administrative expenses (“operating expenses”) at a slower rate than the
growth of its net sales; and the priority of returns focuses on how eciently
the Company employs its assets as reected in its return on investment
(“ROI”) and how eectively the Company manages working capital as
reected in its free cash ow.
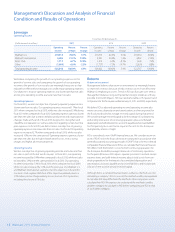
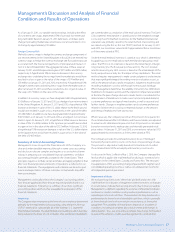
Growth
Net Sales
Fiscal Years Ended January 31,
(Dollar amounts in millions)
2011 2010 2009
Percent Percent Percent Percent Percent
Net Sales of Total Change Net Sales of Total Change Net Sales of Total
Walmart U.S. $260,261 62.1% 0.1% $259,919 64.2% 1.1% $256,970 64.0%
Walmart International 109,232 26.1% 12.1% 97,407 24.0% 1.3% 96,141 24.0%
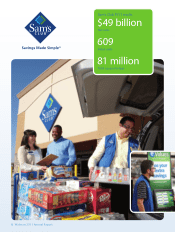
Sam’s Club 49,459 11.8% 3.5% 47,806 11.8% -0.4% 47,976 12.0%
Net Sales $418,952 100.0% 3.4% $405,132 100.0% 1.0% $401,087 100.0%
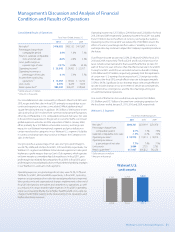
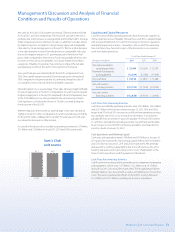
Calendar Comparable Store and Club Sales
Comparable store and club sales is a measure which indicates the performance of our existing U.S. stores and clubs by measuring the growth in sales
for such stores and clubs for a particular period over the corresponding period in the prior year. Comparable store and club sales, including fuel impact,
for the scal years ended January 31, 2011, 2010 and 2009 are as follows:
With Fuel Fuel Impact
Fiscal Years Ended January 31, Fiscal Years Ended January 31,
2011 2010 2009 2011 2010 2009
Walmart U.S. -1.5% -0.7% 3.2% 0.0% 0.0% 0.0%
Sam’s Club 3.9% -1.4% 4.9% 2.0% -2.1% 1.2%
Total U.S. -0.6% -0.8% 3.5% 0.4% -0.3% 0.2%
Comparable store and club sales in the U.S., including fuel, decreased 0.6% and 0.8% in scal 2011 and 2010, respectively, and increased 3.5% in scal 2009.
Total U.S. comparable store and club sales decreased during scal 2011 primarily due to a decline in customer trac. Although customer trac increased
in scal 2010, comparable store sales in the United States were lower than those in scal 2009 due to deation in certain merchandise categories and
lower fuel prices. As we continue to add new stores in the United States, we do so with an understanding that additional stores may take sales away from
existing units. We estimate the negative impact on comparable store sales as a result of opening new stores was approximately 0.8% in scal 2011, 0.6%
in scal 2010 and 1.1% in scal 2009.
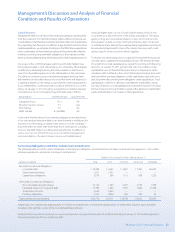
Our consolidated net sales increased by 3.4% and 1.0% in scal 2011 and
scal 2010, respectively, when compared to the previous scal year. Net
sales in scal 2011 increased primarily due to our continued expansion
activities as we added 3.4% of additional retail square feet during scal 2011.
In addition, foreign currency exchange rates favorably impacted our scal
2011 sales growth by approximately $4.5 billion, oset by a 0.6% decline in
total U.S. comparable store and club sales. Net sales in scal 2010 increased
due to increased customer trac, continued global expansion activities and
the acquisition of our Chilean subsidiary, Distribución y Servicio S.A. de C.V.
(“D&S”) in January 2009, oset primarily by a $9.8 billion unfavorable
currency exchange rate impact in our Walmart International segment and
adversely aected by price deation in certain merchandise categories in
our Walmart U.S. segment. Volatility in currency exchange rates may
continue to impact the Company’s net sales in the future.