Walmart 2011 Annual Report Download - page 41
Download and view the complete annual report
Please find page 41 of the 2011 Walmart annual report below. You can navigate through the pages in the report by either clicking on the pages listed below, or by using the keyword search tool below to find specific information within the annual report.-
 1
1 -
2
-
3
-
4
-
5
-
6
-
7
-
8
-
9
-
10
-
11
-
12
-
13
-
14
-
15
-
16
-
17
-
18
-
19
-
20
-
21
-
22
-
23
-
24
-
25
-
26
-
27
-
28
-
29
-
30
-
 31
31 -
 32
32 -
 33
33 -
 34
34 -
 35
35 -
 36
36 -
 37
37 -
 38
38 -
 39
39 -
 40
40 -
 41
41 -
 42
42 -
 43
43 -
 44
44 -
 45
45 -
 46
46 -
 47
47 -
 48
48 -
 49
49 -
 50
50 -
 51
51 -
52
-
53
-
54
-
55
-
56
-
57
-
58
-
59
-
60
-
61
-
62
 |
 |

Walmart 2011 Annual Report 39
As of January 31, 2011, there was $331 million of total unrecognized
compensation cost related to restricted stock and performance share
awards granted under the Plan, which is expected to be recognized
over a weighted-average period of 2.3 years. The total fair value of
shares vested during the scal years ended January 31, 2011, 2010 and
2009, was $142 million, $110 million and $55 million, respectively.
Restricted Stock Rights
In scal 2007, the Company began issuing restricted stock rights to most
associates in lieu of stock option awards. Restricted stock rights are asso-
ciate rights to Company stock after a specied service period. Grants
issued before scal 2009 typically vest over ve years with 40% vesting
three years from grant date and the remaining 60% vesting ve years
from grant date. Beginning in scal 2009, the vesting schedule was
adjusted for new grants to 50% vesting three years from grant date and
the remaining 50% vesting ve years from grant date. The fair value of
each restricted stock right is determined on the date of grant using the
stock price discounted for the expected dividend yield through the vest-
ing period and is recognized ratably over the vesting period. Expected
dividend yield over the vesting period is based on the expected dividend
yield rate over the life of the grant. The weighted-average discount for the
dividend yield used to determine the fair value of restricted stock rights
granted in scal 2011, 2010 and 2009 was 9.1%, 8.5% and 6.8%, respectively.
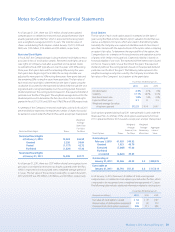
A summary of the Company’s restricted stock rights activity for scal 2011
presented below represents the maximum number of shares that could
be earned or vested under the Plan (in thousands, except per share prices):
Weighted-
Average
Grant-Date
Fair Value
Restricted Stock Rights Shares Per Share
Restricted Stock Rights
at February 1, 2010 14,024 $46.50
Granted 5,520 50.04
Vested (1,177) 42.72
Forfeited (1,529) 47.38
Restricted Stock Rights
at January 31, 2011 16,838 $47.71
As of January 31, 2011, there was $397 million of total unrecognized com-
pensation cost related to restricted stock rights granted under the Plan,
which is expected to be recognized over a weighted-average period of
2.3 years. The fair value of the restricted stock rights vested in scal 2011,
2010 and 2009, was $50 million, $49 million, and $0 million, respectively.
Stock Options
The fair value of each stock option award is estimated on the date of
grant using the Black-Scholes-Merton option valuation model that uses
various assumptions for inputs, which are noted in the following table.
Generally, the Company uses expected volatilities and risk-free interest
rates that correlate with the expected term of the option when estimating
an option’s fair value. To determine the expected life of the option, the
Company bases its estimates on historical exercise and expiration activity
of grants with similar vesting periods. Expected volatility is based on
historical volatility of our stock. The expected risk-free interest rate is based
on the U.S. Treasury yield curve at the time of the grant. The expected
dividend yield over the vesting period is based on the expected dividend
yield rate over the life of the grant. The following table represents the
weighted-average assumptions used by the Company to estimate the
fair values of the Company’s stock options at the grant dates:
Fiscal Years Ended January 31,
2011 2010 2009
Dividend yield 2.3% 2.1% 1.9%
Volatility
17.1% 18.7% 16.7%
Risk-free interest rate 1.8% 1.4% 2.0%
Expected life in years 3.1 3.1 3.4
Weighted-average fair value
of options granted $12.53 $10.41 $9.97
Stock options granted during scal 2011 were primarily issued under the
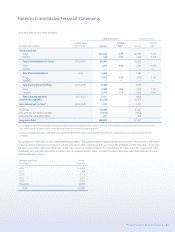
Sharesave Plan. A summary of the stock option award activity for scal
2011 is presented below (in thousands, except years and per share prices):
Weighted- Weighted-
Average Average Aggregate
Exercise Price Remaining Intrinsic
Stock Options Shares Per Share Life in Years Value
Outstanding at
February 1, 2010 41,959 $49.32
Granted 1,921 43.79
Exercised (7,868) 47.66
Forfeited
or expired (2,626) 49.85
Outstanding at
January 31, 2011 33,386 49.35 4.2 $228,076
Exercisable at
January 31, 2011 23,793 $51.31 3.2 $117,319
As of January 31, 2011, there was $42 million of total unrecognized
compensation cost related to stock options granted under the Plan, which
is expected to be recognized over a weighted-average period of 1.2 years.
The following table includes additional information related to stock options:
Fiscal Years Ended January 31,
(Amounts in millions) 2011 2010 2009
Fair value of stock options vested $ 54 $ 79 $107
Intrinsic value of stock options excercised 51 39 173
Proceeds from stock option exercised 205 111 585
Notes to Consolidated Financial Statements