Walmart 2011 Annual Report Download - page 34
Download and view the complete annual report
Please find page 34 of the 2011 Walmart annual report below. You can navigate through the pages in the report by either clicking on the pages listed below, or by using the keyword search tool below to find specific information within the annual report.-
 1
1 -
2
-
3
-
4
-
5
-
6
-
7
-
8
-
9
-
10
-
11
-
12
-
13
-
14
-
15
-
16
-
17
-
18
-
19
-
20
-
21
-
22
-
23
-
 24
24 -
 25
25 -
 26
26 -
 27
27 -
 28
28 -
 29
29 -
 30
30 -
 31
31 -
 32
32 -
 33
33 -
 34
34 -
 35
35 -
 36
36 -
 37
37 -
 38
38 -
 39
39 -
 40
40 -
 41
41 -
 42
42 -
 43
43 -
 44
44 -
45
-
46
-
47
-
48
-
49
-
50
-
51
-
52
-
53
-
54
-
55
-
56
-
57
-
58
-
59
-
60
-
61
-
62
 |
 |

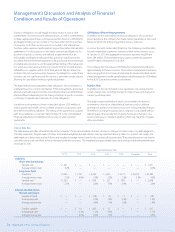
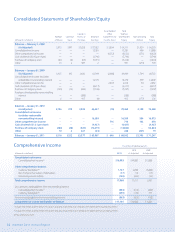
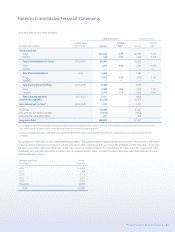
32 Walmart 2011 Annual Report
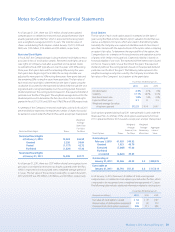
Accumulated Total
Capital in Other Walmart
Number Common Excess of Retained Comprehensive Shareholders’ Noncontrolling Total
(Amounts in millions) of Shares Stock Par Value Earnings Income (Loss) Equity Interest Equity
Balances — February 1, 2008
(As Adjusted) 3,973 $397 $ 3,028 $ 57,022 $ 3,864 $ 64,311 $1,939 $ 66,250
Consolidated net income — — — 13,381 — 13,381 499 13,880
Other comprehensive income — — — — (6,552) (6,552) (371) (6,923)
Cash dividends ($0.95 per share) — — — (3,746) — (3,746) — (3,746)
Purchase of Company stock (61) (6) (95) (3,315) — (3,416) — (3,416)
Other 13 2 987 2 — 991 (273) 718
Balances — January 31, 2009
(As Adjusted) 3,925 393 3,920 63,344 (2,688) 64,969 1,794 66,763
Consolidated net income (excludes
redeemble noncontrolling interest) — — — 14,370 — 14,370 499 14,869
Other comprehensive income — — — 2,618 2,618 64 2,682
Cash dividends ($1.09 per share) — — — (4,217) — (4,217) — (4,217)
Purchase of Company stock (145) (15) (246) (7,136) — (7,397) — (7,397)
Purchase of redeemable noncontrolling
interest — — (288) — — (288) — (288)
Other 6 — 417 (4) — 413 (177) 236
Balances — January 31, 2010
(As Adjusted) 3,786 378 3,803 66,357 (70) 70,468 2,180 72,648
Consolidated net income
(excludes redeemable
noncontrolling interest) — — — 16,389 — 16,389 584 16,973
Other comprehensive income — — — — 716 716 162 878
Cash dividends ($1.21 per share) — — — (4,437) — (4,437) — (4,437)
Purchase of Company stock (280) (28) (487) (14,319) — (14,834) — (14,834)
Other 10 2 261 (23) — 240 (221) 19
Balances — January 31, 2011 3,516 $352 $3,577 $ 63,967 $ 646 $ 68,542 $2,705 $ 71,247
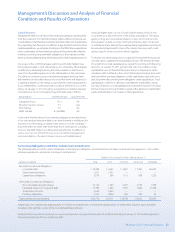
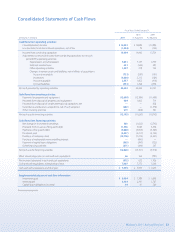
Fiscal Years Ended January 31,
2010 2009
(Amounts in millions) 2011 As Adjusted As Adjusted
Consolidated net income:
Consolidated net income
(1)
$16,993 $14,883 $13,880
Other comprehensive income:
Currency translation
(2)
1,137 2,854 (6,860)
Net change in fair values of derivatives (17) 94 (17)
Minimum pension liability (145) (220) (46)
Total comprehensive income 17,968 17,611 6,957
Less amounts attributable to the noncontrolling interest:
Consolidated net income
(1)
(604) (513) (499)
Currency translation
(2)
(259) (110) 371
Amounts attributable to the noncontrolling interest (863) (623) (128)
Comprehensive income attributable to Walmart $17,105 $16,988 $ 6,829
(1)
Includes $20 million and $14 million in fiscal 2011 and 2010, respectively, that is related to the redeemable noncontrolling interest.
(2)
Includes $97 million and $46 million in fiscal 2011 and 2010, respectively, that is related to the redeemable noncontrolling interest.
See accompanying notes.
Consolidated Statements of Shareholders’ Equity
Comprehensive Income
2010 2009