Walmart 2011 Annual Report Download - page 24
Download and view the complete annual report
Please find page 24 of the 2011 Walmart annual report below. You can navigate through the pages in the report by either clicking on the pages listed below, or by using the keyword search tool below to find specific information within the annual report.-
 1
1 -
2
-
3
-
4
-
5
-
6
-
7
-
8
-
9
-
10
-
11
-
12
-
13
-
 14
14 -
 15
15 -
 16
16 -
 17
17 -
 18
18 -
 19
19 -
 20
20 -
 21
21 -
 22
22 -
 23
23 -
 24
24 -
 25
25 -
 26
26 -
 27
27 -
 28
28 -
 29
29 -
 30
30 -
 31
31 -
 32
32 -
 33
33 -
 34
34 -
35
-
36
-
37
-
38
-
39
-
40
-
41
-
42
-
43
-
44
-
45
-
46
-
47
-
48
-
49
-
50
-
51
-
52
-
53
-
54
-
55
-
56
-
57
-
58
-
59
-
60
-
61
-
62
 |
 |

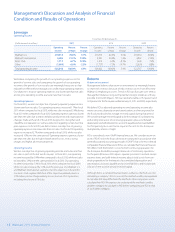
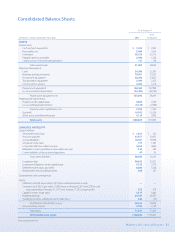
Management’s Discussion and Analysis of Financial
Condition and Results of Operations
22 Walmart 2011 Annual Report
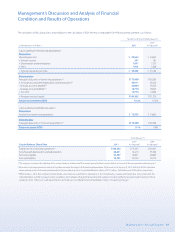
Walmart U.S. net sales were relatively at for scal 2011 compared to scal
2010 as growth in retail square feet was oset by a decline in comparable
store sales of 1.5 percent as a result of slower customer trac. The net
sales growth in scal 2010 resulted from an increase in customer trac
and strength in our grocery and health and wellness categories, as well
as our continued expansion activities.
Gross prot margin was relatively at for scal 2011 as compared to scal
2010. In scal 2010, gross prot margin increased 0.7 percentage points
compared to the prior year due to enhanced merchandising strategies
and lower inventory shrinkage.
Operating expenses, as a percentage of net sales, decreased by 0.3 percent-
age points in scal 2011 compared to scal 2010 due to expense leveraging
principally related to improved labor productivity and a reduction in
incentive plan expenses. Operating expenses, as a percentage of net sales,
increased by 0.4 percentage points in scal 2010 compared to the prior year
due to a smaller increase in net sales as compared to the prior year, higher
health benet costs, higher advertising expenses and a pre-tax charge of
$73 million relating to the restructuring of Walmart U.S. operations.
As a result of the factors discussed above, operating income was
$19.9 billion, $19.3 billion and $18.3 billion for scal 2011, 2010 and 2009,
respectively.
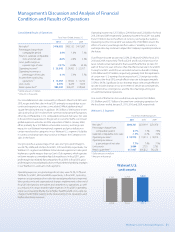
Walmart International Segment
Fiscal Years Ended January 31,
2011 2010 2009
Net Sales
(1)
$109,232 $97,407 $96,141
Percentage change from
comparable period 12.1% 1.3% 6.2%
Operating income
(1)
$ 5,606 $ 4,901 $ 4,832
Operating income as
a percentage of net sales 5.1% 5.0% 5.0%
Unit counts 4,557 4,099 3,595
Retail square feet
(2)
286,680 265,846 244,802
(1)
Dollar amounts in millions
(2)
Amounts in thousands
Net sales for the Walmart International segment increased 12.1% and 1.3%
in scal 2011 and 2010, respectively. Fluctuations in foreign exchange rates
provided a favorable impact of $4.5 billion in scal 2011. The remaining
scal 2011 increase in net sales is primarily due to our markets growing
constant currency sales over last year, as overall retail square feet increased
7.8% during the year. Brazil, China and Mexico contributed some of the
highest sales increases to Walmart International’s net sales growth in scal
2011. The scal 2010 increase in the Walmart International segment’s net
sales primarily resulted from our expansion activities and the inclusion of
the results of D&S, acquired in January 2009, oset by the unfavorable
impact of changes in currency exchange rates of $9.8 billion. For additional
information regarding our acquisitions, refer to Note 15 of the “Notes to
Consolidated Financial Statements.” Volatility in currency exchange rates
may continue to impact the Walmart International segment’s net sales in
the future.
Gross prot margin was relatively at in scal 2011 as compared to scal
2010. In scal 2010, the Walmart International segment’s gross prot margin
increased 0.2 percentage points compared to the prior year. The increase
was primarily driven by currency exchange rate uctuations and the
inclusion of D&S, which was acquired in January 2009.
Operating expenses, as a percentage of net sales, decreased 0.3 percentage
points in scal 2011 compared to scal 2010 due to eective expense
management in Japan and the United Kingdom. Operating expenses, as
a percentage of net sales, increased 0.3 percentage points in scal 2010
compared to the prior year primarily as a result of the inclusion of D&S,
which was acquired in January 2009.
Currency exchange rate uctuations increased operating income by
$231 million in scal 2011 and reduced operating income by $540 million
in scal 2010. Volatility in currency exchange rates may continue to impact
the Walmart International segment’s operating results in the future.
As a result of the factors discussed above, operating income was $5.6 billion,
$4.9 billion and $4.8 billion for scal 2011, 2010 and 2009, respectively.
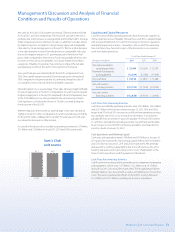
Sam’s Club Segment
Fiscal Years Ended January 31,
2011 2010 2009
Net Sales
(1)
$49,459 $47,806 $47,976
Percentage change from
comparable period 3.5% -0.4% 8.2%
Calendar comparable club sales
(2)
3.9% -1.4% 4.9%
Operating income
(1)
$ 1,711 $ 1,515 $ 1,649
Operating income as
a percentage of net sales 3.5% 3.2% 3.4%
Unit counts 609 605 611
Retail square feet
(3)
81,202 80,539 80,986
(1)
Dollar amounts in millions
(2)
Includes fuel sales, which impacted our comparable club sales by 2.0%, (2.1% )
and 1.2%, respectively, in fiscal 2011, 2010 and 2009
(3)
Amounts in thousands
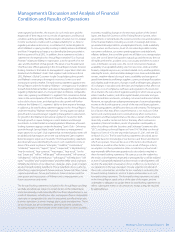
Walmart International
unit counts
4,557
4,099
3,595
FY09 FY10 FY11