Walmart 2011 Annual Report Download - page 52
Download and view the complete annual report
Please find page 52 of the 2011 Walmart annual report below. You can navigate through the pages in the report by either clicking on the pages listed below, or by using the keyword search tool below to find specific information within the annual report.-
 1
1 -
2
-
3
-
4
-
5
-
6
-
7
-
8
-
9
-
10
-
11
-
12
-
13
-
14
-
15
-
16
-
17
-
18
-
19
-
20
-
21
-
22
-
23
-
24
-
25
-
26
-
27
-
28
-
29
-
30
-
31
-
32
-
33
-
34
-
35
-
36
-
37
-
38
-
39
-
40
-
41
-
 42
42 -
 43
43 -
 44
44 -
 45
45 -
 46
46 -
 47
47 -
 48
48 -
 49
49 -
 50
50 -
 51
51 -
 52
52 -
 53
53 -
 54
54 -
 55
55 -
 56
56 -
 57
57 -
 58
58 -
 59
59 -
 60
60 -
 61
61 -
 62
62
 |
 |

50 Walmart 2011 Annual Report
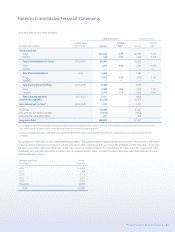
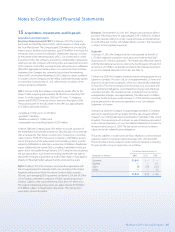
16 Segments
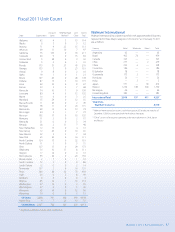
The Company is engaged in the operations of retail stores located in all 50 states of the United States and Puerto Rico, Argentina, Brazil, Canada, Japan,
the United Kingdom, Chile, Mexico and Central America, China and India. The Company’s operations are conducted in three reportable segments:
(1) the Walmart U.S. segment; (2) the Walmart International segment; and (3) the Sam’s Club segment. The Company denes its segments as those
business units whose operating results its chief operating decision maker (“CODM”) regularly reviews to analyze performance and allocate resources.
The Company sells similar individual products and services in each of its segments. It is impractical to segregate and identify revenue and prots for
each individual product and service.
As part of an operational realignment in scal 2011, the Puerto Rico operations shifted from the Walmart International segment to the respective
Walmart U.S. and Sam’s Club segments. The Walmart U.S. segment includes the Company’s mass merchant concept in the United States and Puerto
Rico, operating under the “Walmart” or “Wal-Mart” brand, as well as walmart.com. The Walmart International segment consists of the Company’s
operations outside of the United States and Puerto Rico. The Sam’s Club segment includes the warehouse membership clubs in the United States
and Puerto Rico, as well as samsclub.com. All prior period segment amounts have been reclassied to conform to the current period’s presentation.
The amounts under the caption “Other” in the table below relating to operating income (loss) are unallocated corporate overhead items.
The Company measures the results of its segments using, among other measures, each segment’s operating income, which includes certain corporate
overhead allocations. From time to time, the Company revises the measurement of each segment’s operating income, including any corporate over-
head allocations, as dictated by the information regularly reviewed by its CODM. In the rst quarter of scal 2011, certain information systems’ expenses
previously included in unallocated corporate overhead have been allocated to the segment that is directly benetting from those costs. The segment
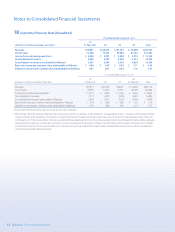
operating income is reclassied for all periods presented to conform to the current period’s presentation. Information for our segments and the
reconciliation to consolidated income from continuing operations before income taxes appear in the following table:
Walmart
(Amounts in millions) Walmart U.S. International Sam’sClub Other Consolidated
Fiscal Year Ended January31, 2011
Net sales $260,261 $109,232 $49,459 $ — $418,952
Operating income (loss) 19,914 5,606 1,711 (1,689) 25,542
Interest expense, net (2,004)
Income from continuing operations before income taxes $ 23,538
Total assets of continuing operations $ 89,725 $ 72,021 $12,531 $ 6,255 $180,532
Depreciation and amortization 4,619 2,184 594 244 7,641
Fiscal Year Ended January31, 2010
Net sales
(1)
$ 259,919 $ 97,407 $ 47,806 $ — $ 405,132
Operating income (loss)
(1)
19,313 4,901 1,515 (1,727) 24,002
Interest expense, net (1,884)
Income from continuing operations before income taxes
(1)
$ 22,118
Total assets of continuing operations
(1)
$ 84,238 $ 66,515 $ 12,050 $ 7,464 $ 170,267
Depreciation and amortization 4,352 1,979 558 268 7,157
Fiscal Year Ended January31, 2009
Net sales
(1)
$ 256,970 $ 96,141 $ 47,976 $ — $ 401,087
Operating income (loss)
(1)
18,310 4,832 1,649 (2,024) 22,767
Interest expense, net (1,900)
Income from continuing operations before income taxes
(1)
$ 20,867
Total assets of continuing operations
(1)
$ 84,362 $ 59,071 $ 12,388 $ 7,080 $ 162,901
Depreciation and amortization 4,148 1,845 543 $203 6,739
(1)
As Adjusted
Notes to Consolidated Financial Statements