Walmart 2011 Annual Report Download - page 46
Download and view the complete annual report
Please find page 46 of the 2011 Walmart annual report below. You can navigate through the pages in the report by either clicking on the pages listed below, or by using the keyword search tool below to find specific information within the annual report.-
 1
1 -
2
-
3
-
4
-
5
-
6
-
7
-
8
-
9
-
10
-
11
-
12
-
13
-
14
-
15
-
16
-
17
-
18
-
19
-
20
-
21
-
22
-
23
-
24
-
25
-
26
-
27
-
28
-
29
-
30
-
31
-
32
-
33
-
34
-
35
-
 36
36 -
 37
37 -
 38
38 -
 39
39 -
 40
40 -
 41
41 -
 42
42 -
 43
43 -
 44
44 -
 45
45 -
 46
46 -
 47
47 -
 48
48 -
 49
49 -
 50
50 -
 51
51 -
 52
52 -
 53
53 -
 54
54 -
 55
55 -
 56
56 -
57
-
58
-
59
-
60
-
61
-
62
 |
 |

44 Walmart 2011 Annual Report
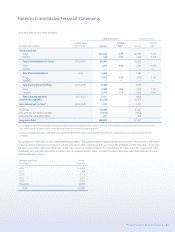
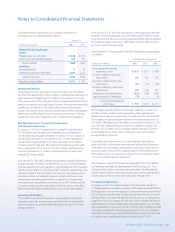
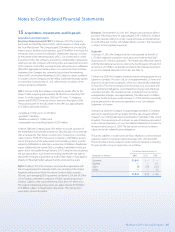
As of January 31, 2011 and 2010, our nancial instruments were classied as follows in the accompanying Consolidated Balance Sheets:
January 31, 2011 January 31, 2010
Fair Value Net Investment Cash Flow Fair Value Net Investment Cash Flow
(Amounts in millions) Instruments Hedge Instruments Instruments Hedge Instruments
Balance Sheet Classication:
Other assets and deferred charges $267 $233 $238 $260 $189 $286
Assets subtotals $267 $233 $238 $260 $189 $286
Long-term debt $267 $ — $ — $260 $ — $ —
Deferred income taxes and other — — 18 — — 20
Liability subtotals $267 $ — $ 18 $260 $ — $ 20
Notes to Consolidated Financial Statements
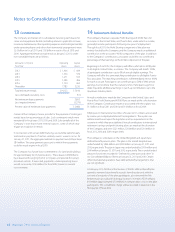
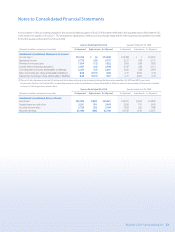
10 Taxes
Income from Continuing Operations
The components of income from continuing operations before income
taxes are as follows:
Fiscal Years Ended January31,
(Amounts in millions) 2011 2010 2009
U.S. $18,398 $17,705 $16,212
Non-U.S. 5,140 4,413 4,655
Total income from continuing
operations before income taxes $23,538 $22,118 $20,867
A summary of the provision for income taxes is as follows:
Fiscal Years Ended January31,
2010 2009
(Amounts in millions) 2011 As Adjusted As Adjusted
Current:
U.S. federal $4,600 $5,798 $4,771
U.S. state and local 637 599 564
International 1,466 1,246 1,229
Total current tax provision 6,703 7,643 6,564
Deferred:
U.S. federal 818 (432) 603
U.S. state and local 39 78 41
International 19 (133) (75)
Total deferred tax provision 876 (487) 569
Total provision for income taxes $7,579 $7,156 $7,133
Eective Tax Rate Reconciliation
A reconciliation of the signicant dierences between the U.S.
statutory tax rate and the eective income tax rate on pretax income
from continuing operations is as follows:
Fiscal Years Ended January31,
2011 2010 2009
U.S. statutory tax rate 35.0% 35.0% 35.0%
U.S. state income taxes, net of
federal income tax benet 1.9% 2.0% 1.9%
Income taxed outside the U.S. -2.2% -1.6% -1.7%
Net impact of repatriated
international earnings -1.5% -3.4% -1.1%
Other, net -1.0% 0.4% 0.1%
Eective income tax rate 32.2% 32.4% 34.2%
Deferred Taxes
The signicant components of our deferred tax account balances are
as follows:
January 31,
(Amounts in millions) 2011 2010
Deferred tax assets:
Loss and tax credit carryforwards $ 2,968 $ 2,713
Accrued liabilities 3,532 3,141
Share-based compensation 332 267
Other
708 751
Total deferred tax assets 7,540 6,872
Valuation allowance (2,899) (2,167)
Deferred tax assets, net of valuation allowance $ 4,641 $ 4,705
Deferred tax liabilities:
Property and equipment $ 4,848 $ 4,015
Inventories
1,014 972
Other 474 609
Total deferred tax liabilities 6,336 5,596
Net deferred tax liabilities $ 1,695 $ 891