Walmart 2011 Annual Report Download - page 26
Download and view the complete annual report
Please find page 26 of the 2011 Walmart annual report below. You can navigate through the pages in the report by either clicking on the pages listed below, or by using the keyword search tool below to find specific information within the annual report.-
 1
1 -
2
-
3
-
4
-
5
-
6
-
7
-
8
-
9
-
10
-
11
-
12
-
13
-
14
-
15
-
 16
16 -
 17
17 -
 18
18 -
 19
19 -
 20
20 -
 21
21 -
 22
22 -
 23
23 -
 24
24 -
 25
25 -
 26
26 -
 27
27 -
 28
28 -
 29
29 -
 30
30 -
 31
31 -
 32
32 -
 33
33 -
 34
34 -
 35
35 -
 36
36 -
37
-
38
-
39
-
40
-
41
-
42
-
43
-
44
-
45
-
46
-
47
-
48
-
49
-
50
-
51
-
52
-
53
-
54
-
55
-
56
-
57
-
58
-
59
-
60
-
61
-
62
 |
 |
Management’s Discussion and Analysis of Financial
Condition and Results of Operations
24 Walmart 2011 Annual Report
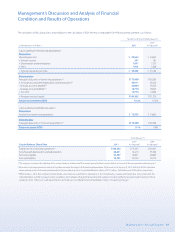
Global Expansion Activities
We expect to nance our scal 2012 global expansion plans primarily
through cash ows from operations and future debt nancings. The
following table represents our estimated range for growth in retail
square feet by segment for scal 2012. This table does not include
growth in retail square feet from pending or future acquisitions.
Fiscal Year 2012
Projected Growth
(In thousands) in Retail Square Feet
Walmart U.S. segment 10,000 – 11,000
Sam’s Club segment 400 – 600
Total U.S. 10,400 – 11,600
Walmart International segment 23,000 – 24,000
Grand Total 33,400 – 35,600
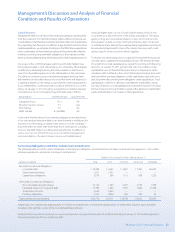
The following table represents an allocation of our capital expenditures
for property and equipment:
Allocation of Capital Expenditures
Fiscal Years Ending January 31,
Projected Actual
Capital Expenditures 2012 2011 2010
New stores, including
expansions and relocations 33% 24% 29%
Remodels 11% 26% 17%
Information systems,
distribution and other 23% 19% 23%
Total U.S. 67% 69% 69%
International 33%
31% 31%
Total Capital Expenditures 100% 100% 100%
Pending Business Acquisitions
As discussed in Note 15 to the consolidated nancial statements, the
Company currently anticipates completing the following business
combinations during scal 2012:
• Netto: On May 27, 2010, the Company announced an agreement with
Dansk Supermarked A/S, whereby ASDA, our subsidiary in the United
Kingdom (U.K.), will purchase Netto Foodstores Limited. Netto operates
193 units, each averaging 8,000 square feet. On March 9, 2011, the U.K.
Oce of Fair Trading conrmed its clearance of ASDA’s proposed purchase
of Netto, subject to the requirement that ASDA divest 47 Netto units.
The original estimated purchase price was approximately £778 million
($1.2 billion), subject to nalizing any divestitures; and
• Massmart: On November 29, 2010, the Company announced an oer to
purchase 51% of Massmart for approximately ZAR 17 billion ($2.3 billion).
Massmart operates 288 units under several wholesale and retail banners
in South Africa and 13 other sub-Saharan African countries. The transaction
is subject to nal regulatory approval.
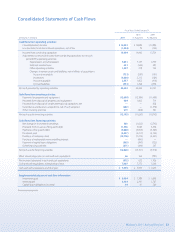
Cash Flows from Financing Activities
Short-Term Borrowings
Net short-term borrowings increased by $503 million in scal 2011, and
decreased by $1.0 billion and $3.7 billion in scal 2010 and 2009, respec-
tively. From time to time, we utilize the liquidity under our short-term
borrowing programs to fund our operations, dividend payments, share
repurchases, capital expenditures, and for other cash requirements and
corporate purposes on an as needed basis.
Long-Term Debt
Proceeds from the issuance of long-term debt were $11.4 billion, $5.5 billion,
and $6.6 billion for the scal years ended January 31, 2011, 2010 and 2009,
respectively. The proceeds from the issuance of long-term debt were
used to pay down or renance existing debt, and for other general
corporate purposes.
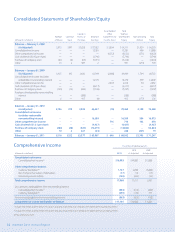
Dividends
On March 3, 2011, our Board of Directors approved an increase in the
annual dividend for scal 2012 to $1.46 per share, an increase of
approximately 21% over the dividends paid in scal 2011. Dividends
per share were $1.21 and $1.09 in scal 2011 and 2010, respectively. For
the scal year ending January 31, 2012, the annual dividend will be
paid in four quarterly installments according to the following record
and payable dates:
Record Date Payable Date
March 11, 2011 April 4, 2011
May 13, 2011 June 6, 2011
August 12, 2011 September 6, 2011
December 9, 2011 January 3, 2012
We paid dividends of $4.4 billion, $4.2 billion and $3.7 billion for scal
2011, 2010 and 2009, respectively. We expect to pay aggregate dividends
of approximately $5.1 billion in scal 2012.
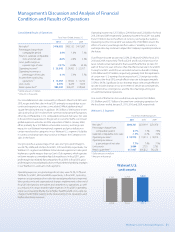
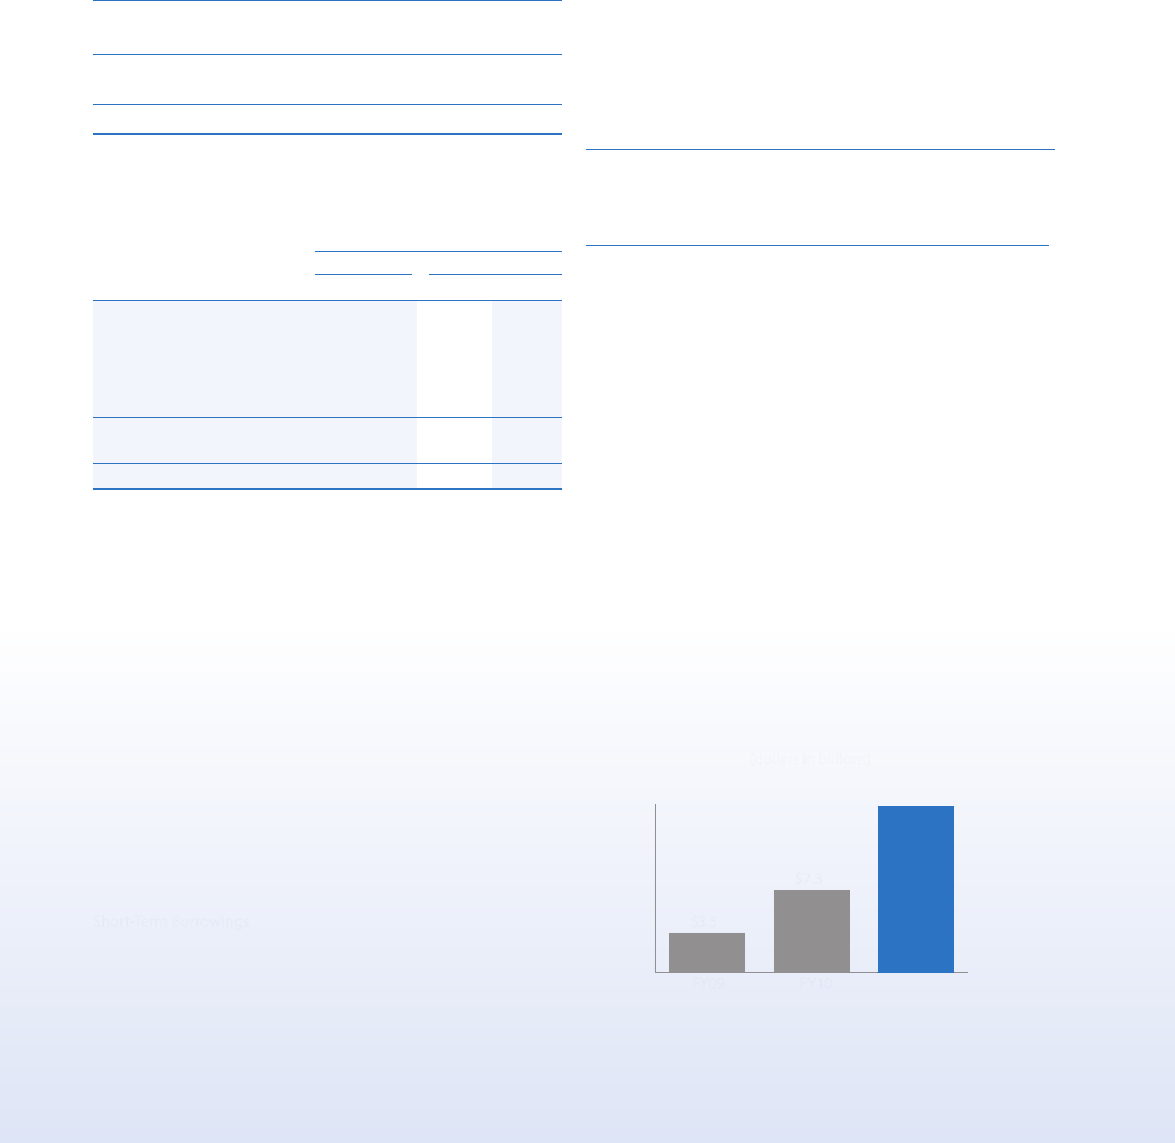
Company Share Repurchase Program
On June 3, 2010, the Board of Directors authorized a new $15.0 billion
share repurchase program, which was announced on June 4, 2010. The
program has no expiration date or other restriction limiting the period
over which we can make our share repurchases and will expire only when
and if we have repurchased $15.0 billion of our shares under the program
or we earlier terminate or replace the program. Any repurchased shares
are constructively retired and returned to an unissued status. We spent
approximately $14.8 billion, $7.3 billion and $3.5 billion for share repur-
chases during the scal years ended January 31, 2011, 2010 and 2009,
respectively. We consider several factors in determining when to execute
the share repurchases, including, among other things, our current cash
needs, our capacity for leverage, our cost of borrowings and the market
price of our common stock. At January 31, 2011, we had approximately
$4.8 billion of remaining authorization to spend for share repurchases
under the existing program.
Share repurchases
(dollars in billions)
$14.8
$7.3
$3.5
FY09 FY10 FY11