Walmart 2011 Annual Report Download - page 35
Download and view the complete annual report
Please find page 35 of the 2011 Walmart annual report below. You can navigate through the pages in the report by either clicking on the pages listed below, or by using the keyword search tool below to find specific information within the annual report.-
 1
1 -
2
-
3
-
4
-
5
-
6
-
7
-
8
-
9
-
10
-
11
-
12
-
13
-
14
-
15
-
16
-
17
-
18
-
19
-
20
-
21
-
22
-
23
-
24
-
 25
25 -
 26
26 -
 27
27 -
 28
28 -
 29
29 -
 30
30 -
 31
31 -
 32
32 -
 33
33 -
 34
34 -
 35
35 -
 36
36 -
 37
37 -
 38
38 -
 39
39 -
 40
40 -
 41
41 -
 42
42 -
 43
43 -
 44
44 -
 45
45 -
46
-
47
-
48
-
49
-
50
-
51
-
52
-
53
-
54
-
55
-
56
-
57
-
58
-
59
-
60
-
61
-
62
 |
 |

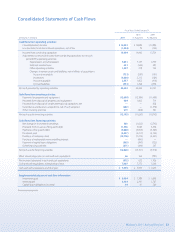
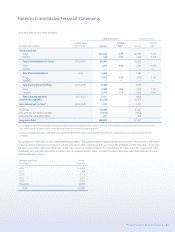
Walmart 2011 Annual Report 33
Fiscal Years Ended January 31,
2010 2009
(Amounts in millions) 2011 As Adjusted As Adjusted
Cash ows from operating activities:
Consolidated net income $ 16,993 $ 14,883 $ 13,880
Loss (income) from discontinued operations, net of tax (1,034) 79 (146)
Income from continuing operations 15,959 14,962 13,734
Adjustments to reconcile income from continuing operations to net cash
provided by operating activities:
Depreciation and amortization 7,641 7,157 6,739
Deferred income taxes 651 (504) 581
Other operating activities 1,087 318 752
Changes in certain assets and liabilities, net of eects of acquisitions:
Accounts receivable (733) (297) (101)
Inventories (3,086) 2,213 (184)
Accounts payable 2,557 1,052 (410)
Accrued liabilities (433) 1,348 2,036
Net cash provided by operating activities 23,643 26,249 23,147
Cash ows from investing activities:
Payments for property and equipment (12,699) (12,184) (11,499)
Proceeds from disposal of property and equipment 489 1,002 714
Proceeds from disposal of certain international operations, net — — 838
Investments and business acquisitions, net of cash acquired (202) — (1,576)
Other investing activities 219 (438) 781
Net cash used in investing activities (12,193) (11,620) (10,742)
Cash ows from nancing activities:
Net change in short-term borrowings 503 (1,033) (3,745)
Proceeds from issuance of long-term debt 11,396 5,546 6,566
Payments of long-term debt (4,080) (6,033) (5,387)
Dividends paid (4,437) (4,217) (3,746)
Purchase of Company stock (14,776) (7,276) (3,521)
Purchase of redeemable noncontrolling interest — (436) —
Payment of capital lease obligations (363) (346) (352)
Other nancing activities (271) (396) 267
Net cash used in nancing activities (12,028) (14,191) (9,918)
Eect of exchange rates on cash and cash equivalents 66 194 (781)
Net increase (decrease) in cash and cash equivalents (512) 632 1,706
Cash and cash equivalents at beginning of year
7,907 7,275 5,569
Cash and cash equivalents at end of year
$ 7,395 $ 7,907 $ 7,275
Supplemental disclosure of cash ow information
Income tax paid $ 6,984 $ 7,389 $ 6,596
Interest paid 2,163 2,141 1,787
Capital lease obligations incurred 49 61 284
See accompanying notes.
Consolidated Statements of Cash Flows
2010 2009