Walmart 2011 Annual Report Download - page 25
Download and view the complete annual report
Please find page 25 of the 2011 Walmart annual report below. You can navigate through the pages in the report by either clicking on the pages listed below, or by using the keyword search tool below to find specific information within the annual report.-
 1
1 -
2
-
3
-
4
-
5
-
6
-
7
-
8
-
9
-
10
-
11
-
12
-
13
-
14
-
 15
15 -
 16
16 -
 17
17 -
 18
18 -
 19
19 -
 20
20 -
 21
21 -
 22
22 -
 23
23 -
 24
24 -
 25
25 -
 26
26 -
 27
27 -
 28
28 -
 29
29 -
 30
30 -
 31
31 -
 32
32 -
 33
33 -
 34
34 -
 35
35 -
36
-
37
-
38
-
39
-
40
-
41
-
42
-
43
-
44
-
45
-
46
-
47
-
48
-
49
-
50
-
51
-
52
-
53
-
54
-
55
-
56
-
57
-
58
-
59
-
60
-
61
-
62
 |
 |

Management’s Discussion and Analysis of Financial
Condition and Results of Operations
Walmart 2011 Annual Report 23
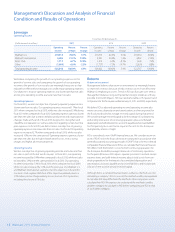
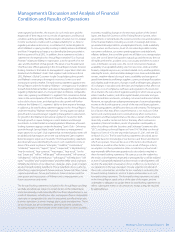
Net sales for the Sam’s Club segment increased 3.5% and decreased 0.4%
for scal 2011 and 2010, respectively. The scal 2011 growth in net sales is
primarily due to the increase in average ticket and member trac. Average
ticket increased at a faster rate than net sales. In addition, fuel sales, driven
by higher fuel prices and gallons sold, positively impacted comparable
club sales by 2.0 percentage points in scal 2011. The scal 2010 decrease
in net sales primarily resulted from the decline in comparable club sales
due to the negative impact of 2.1 percentage points from lower fuel
prices when compared to the previous scal year, partially oset by sales
increases in fresh food, consumables and certain health and wellness
categories. Volatility in fuel prices may continue to impact the net sales
and operating income of the Sam’s Club segment in the future.
Gross prot margin was relatively at for scal 2011 compared to scal
2010. Gross prot margin increased 0.6 percentage points during scal
2010 compared to the prior year due to continued strength in sales of
consumables, fresh food and other food-related categories.
Operating expenses, as a percentage of net sales, decreased approximately
0.5 percentage points in scal 2011 compared to scal 2010 and increased
0.8 percentage points in scal 2010 compared to scal 2009 primarily due
to the $174 million pre-tax charge related to the restructuring of Sam’s
Club operations, including the closure of 10 clubs, incurred during the
fourth quarter of scal 2010.
Membership and other income, as a percentage of net sales, decreased
slightly in scal 2011 when compared to scal 2010 and decreased slightly
for scal 2010 when compared to scal 2009. The decrease in both years
was driven by decreases in other income.
As a result of the factors discussed above, operating income was $1.7 billion,
$1.5 billion and $1.6 billion for scal 2011, 2010 and 2009, respectively.
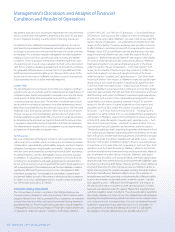
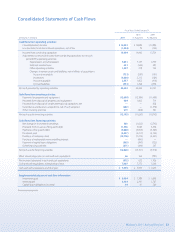
Liquidity and Capital Resources
Cash ows provided by operating activities have historically supplied us
with a signicant source of liquidity. We use these cash ows, supplemented
with long-term debt and short-term borrowings, to fund our operations
and global expansion activities. Generally, some or all of the remaining
free cash ow, if any, funds all or part of the dividends on our common
stock and share repurchases.
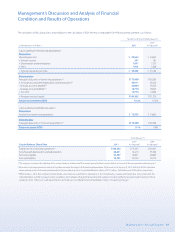
Fiscal Years Ended January 31,
(Amounts in millions) 2011 2010 2009
Net cash provided by
operating activities $ 23,643 $ 26,249 $ 23,147
Payments for property
and equipment (12,699) (12,184) (11,499)
Free cash ow $ 10,944 $ 14,065 $ 11,648
Net cash used in
investing activities $(12,193) $(11,620) $(10,742)
Net cash used in
nancing activities $(12,028) $(14,191) $ (9,918)
Cash Flows from Operating Activities
Cash ows provided by operating activities were $23.6 billion, $26.2 billion
and $23.1 billion for scal years ended January 31, 2011, 2010 and 2009,
respectively. The scal 2011 decrease in cash ow from operating activities
was primarily the result of our increased investments in inventories,
partially oset by an increase in accounts payable. The scal 2010 increase
in cash ows provided by operating activities was primarily attributable
to an increase in income from continuing operations and relatively low
inventory levels at January 31, 2010.
Cash Equivalents and Working Capital
Cash and cash equivalents were $7.4 billion and $7.9 billion at January 31,
2011 and 2010, respectively. Our working capital decits were $6.6 billion
and $7.5 billion at January 31, 2011 and 2010, respectively. We generally
operate with a working capital decit due to our ecient use of cash in
funding operations and in providing returns to our shareholders in the
form of stock repurchases and the payment of dividends.
Cash Flows from Investing Activities
Cash ows from investing activities generally consist of payments for property
and equipment, which were $12.7 billion, $12.2 billion and $11.5 billion
during scal 2011, 2010 and 2009, respectively. These capital expenditures
primarily relate to new store growth, as well as remodeling costs for existing
stores. We expect capital expenditures for scal 2012 to range between
$12.5 billion and $13.5 billion, excluding any business acquisitions.
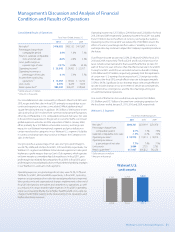
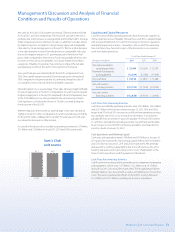
Sam’s Club
unit counts
609
605
611
FY09 FY10 FY11